Latvian vs Czech Unemployment Among Youth under 25 years

COMPARE

Latvian
Race
Ancestry
AfghanAfricanAlaska NativeAlaskan AthabascanAlbanianAleutAlsatianAmericanApacheArabArapahoArgentineanArmenianAssyrian/Chaldean/SyriacAustralianAustrianBahamianBangladeshiBarbadianBasqueBelgianBelizeanBermudanBhutaneseBlackfeetBolivianBrazilianBritishBritish West IndianBulgarianBurmeseCajunCambodianCanadianCape VerdeanCarpatho RusynCelticCentral AmericanCentral American IndianCherokeeCheyenneChickasawChileanChineseChippewaChoctawColombianColvilleComancheCosta RicanCreeCreekCroatianCrowCubanCypriotCzechoslovakianDanishDelawareDominicanDutchDutch West IndianEastern EuropeanEcuadorianEgyptianEnglishEstonianEthiopianEuropeanFijianFilipinoFinnishFrenchFrench American IndianFrench CanadianGermanGerman RussianGhanaianGreekGuamanian/ChamorroGuatemalanGuyaneseHaitianHmongHonduranHopiHoumaHungarianIcelanderIndian (Asian)IndonesianInupiatIranianIraqiIrishIroquoisIsraeliItalianJamaicanJapaneseJordanianKenyanKiowaKoreanLaotianLatvianLebaneseLiberianLithuanianLumbeeLuxembourgerMacedonianMalaysianMalteseMarshalleseMenomineeMexicanMexican American IndianMongolianMoroccanNative HawaiianNavajoNepaleseNew ZealanderNicaraguanNigerianNorthern EuropeanNorwegianOkinawanOsageOttawaPaiutePakistaniPalestinianPanamanianParaguayanPennsylvania GermanPeruvianPimaPolishPortuguesePotawatomiPuebloPuerto RicanPuget Sound SalishRomanianRussianSalvadoranSamoanScandinavianScotch-IrishScottishSeminoleSenegaleseSerbianShoshoneSierra LeoneanSiouxSlavicSlovakSloveneSomaliSouth AfricanSouth AmericanSouth American IndianSoviet UnionSpaniardSpanishSpanish AmericanSpanish American IndianSri LankanSubsaharan AfricanSudaneseSwedishSwissSyrianTaiwaneseThaiTlingit-HaidaTohono O'OdhamTonganTrinidadian and TobagonianTsimshianTurkishU.S. Virgin IslanderUgandanUkrainianUruguayanUteVenezuelanVietnameseWelshWest IndianYakamaYaquiYugoslavianYumanYup'ikZimbabwean
Immigration
NonimmigrantsImmigrantsAfghanistanAfricaAlbaniaArgentinaArmeniaAsiaAustraliaAustriaBahamasBangladeshBarbadosBelarusBelgiumBelizeBoliviaBosnia and HerzegovinaBrazilBulgariaBurma/MyanmarCabo VerdeCambodiaCameroonCanadaCaribbeanCentral AmericaChileChinaColombiaCongoCosta RicaCroatiaCubaCzechoslovakiaDenmarkDominicaDominican RepublicEastern AfricaEastern AsiaEastern EuropeEcuadorEgyptEl SalvadorEnglandEritreaEthiopiaEuropeFijiFranceGermanyGhanaGreeceGrenadaGuatemalaGuyanaHaitiHondurasHong KongHungaryIndiaIndonesiaIranIraqIrelandIsraelItalyJamaicaJapanJordanKazakhstanKenyaKoreaKuwaitLaosLatin AmericaLatviaLebanonLiberiaLithuaniaMalaysiaMexicoMicronesiaMiddle AfricaMoldovaMoroccoNepalNetherlandsNicaraguaNigeriaNorth AmericaNorth MacedoniaNorthern AfricaNorthern EuropeNorwayOceaniaPakistanPanamaPeruPhilippinesPolandPortugalRomaniaRussiaSaudi ArabiaScotlandSenegalSerbiaSierra LeoneSingaporeSomaliaSouth AfricaSouth AmericaSouth Central AsiaSouth Eastern AsiaSouthern EuropeSpainSri LankaSt. Vincent and the GrenadinesSudanSwedenSwitzerlandSyriaTaiwanThailandTrinidad and TobagoTurkeyUgandaUkraineUruguayUzbekistanVenezuelaVietnamWest IndiesWestern AfricaWestern AsiaWestern EuropeYemenZaireZimbabweAzores
Czech
Race
Ancestry
AfghanAfricanAlaska NativeAlaskan AthabascanAlbanianAleutAlsatianAmericanApacheArabArapahoArgentineanArmenianAssyrian/Chaldean/SyriacAustralianAustrianBahamianBangladeshiBarbadianBasqueBelgianBelizeanBermudanBhutaneseBlackfeetBolivianBrazilianBritishBritish West IndianBulgarianBurmeseCajunCambodianCanadianCape VerdeanCarpatho RusynCelticCentral AmericanCentral American IndianCherokeeCheyenneChickasawChileanChineseChippewaChoctawColombianColvilleComancheCosta RicanCreeCreekCroatianCrowCubanCypriotCzechCzechoslovakianDanishDelawareDominicanDutchDutch West IndianEastern EuropeanEcuadorianEgyptianEnglishEstonianEthiopianEuropeanFijianFilipinoFinnishFrenchFrench American IndianFrench CanadianGermanGerman RussianGhanaianGreekGuamanian/ChamorroGuatemalanGuyaneseHaitianHmongHonduranHopiHoumaHungarianIcelanderIndian (Asian)IndonesianInupiatIranianIraqiIrishIroquoisIsraeliItalianJamaicanJapaneseJordanianKenyanKiowaKoreanLaotianLebaneseLiberianLithuanianLumbeeLuxembourgerMacedonianMalaysianMalteseMarshalleseMenomineeMexicanMexican American IndianMongolianMoroccanNative HawaiianNavajoNepaleseNew ZealanderNicaraguanNigerianNorthern EuropeanNorwegianOkinawanOsageOttawaPaiutePakistaniPalestinianPanamanianParaguayanPennsylvania GermanPeruvianPimaPolishPortuguesePotawatomiPuebloPuerto RicanPuget Sound SalishRomanianRussianSalvadoranSamoanScandinavianScotch-IrishScottishSeminoleSenegaleseSerbianShoshoneSierra LeoneanSiouxSlavicSlovakSloveneSomaliSouth AfricanSouth AmericanSouth American IndianSoviet UnionSpaniardSpanishSpanish AmericanSpanish American IndianSri LankanSubsaharan AfricanSudaneseSwedishSwissSyrianTaiwaneseThaiTlingit-HaidaTohono O'OdhamTonganTrinidadian and TobagonianTsimshianTurkishU.S. Virgin IslanderUgandanUkrainianUruguayanUteVenezuelanVietnameseWelshWest IndianYakamaYaquiYugoslavianYumanYup'ikZimbabwean
Immigration
NonimmigrantsImmigrantsAfghanistanAfricaAlbaniaArgentinaArmeniaAsiaAustraliaAustriaBahamasBangladeshBarbadosBelarusBelgiumBelizeBoliviaBosnia and HerzegovinaBrazilBulgariaBurma/MyanmarCabo VerdeCambodiaCameroonCanadaCaribbeanCentral AmericaChileChinaColombiaCongoCosta RicaCroatiaCubaCzechoslovakiaDenmarkDominicaDominican RepublicEastern AfricaEastern AsiaEastern EuropeEcuadorEgyptEl SalvadorEnglandEritreaEthiopiaEuropeFijiFranceGermanyGhanaGreeceGrenadaGuatemalaGuyanaHaitiHondurasHong KongHungaryIndiaIndonesiaIranIraqIrelandIsraelItalyJamaicaJapanJordanKazakhstanKenyaKoreaKuwaitLaosLatin AmericaLatviaLebanonLiberiaLithuaniaMalaysiaMexicoMicronesiaMiddle AfricaMoldovaMoroccoNepalNetherlandsNicaraguaNigeriaNorth AmericaNorth MacedoniaNorthern AfricaNorthern EuropeNorwayOceaniaPakistanPanamaPeruPhilippinesPolandPortugalRomaniaRussiaSaudi ArabiaScotlandSenegalSerbiaSierra LeoneSingaporeSomaliaSouth AfricaSouth AmericaSouth Central AsiaSouth Eastern AsiaSouthern EuropeSpainSri LankaSt. Vincent and the GrenadinesSudanSwedenSwitzerlandSyriaTaiwanThailandTrinidad and TobagoTurkeyUgandaUkraineUruguayUzbekistanVenezuelaVietnamWest IndiesWestern AfricaWestern AsiaWestern EuropeYemenZaireZimbabweAzores
Unemployment Among Youth under 25 years
Income
Poverty
Unemployment
Labor Participation
Family Structure
Vehicle Availability
Education Level
Disability

Unemployment Among Youth under 25 years Comparison

Latvians

Czechs

Exceptional
Exceptional
11.0%
UNEMPLOYMENT AMONG YOUTH UNDER 25 YEARS
99.0/ 100
METRIC RATING
52nd/ 347
METRIC RANK
10.3%
UNEMPLOYMENT AMONG YOUTH UNDER 25 YEARS
100.0/ 100
METRIC RATING
5th/ 347
METRIC RANK

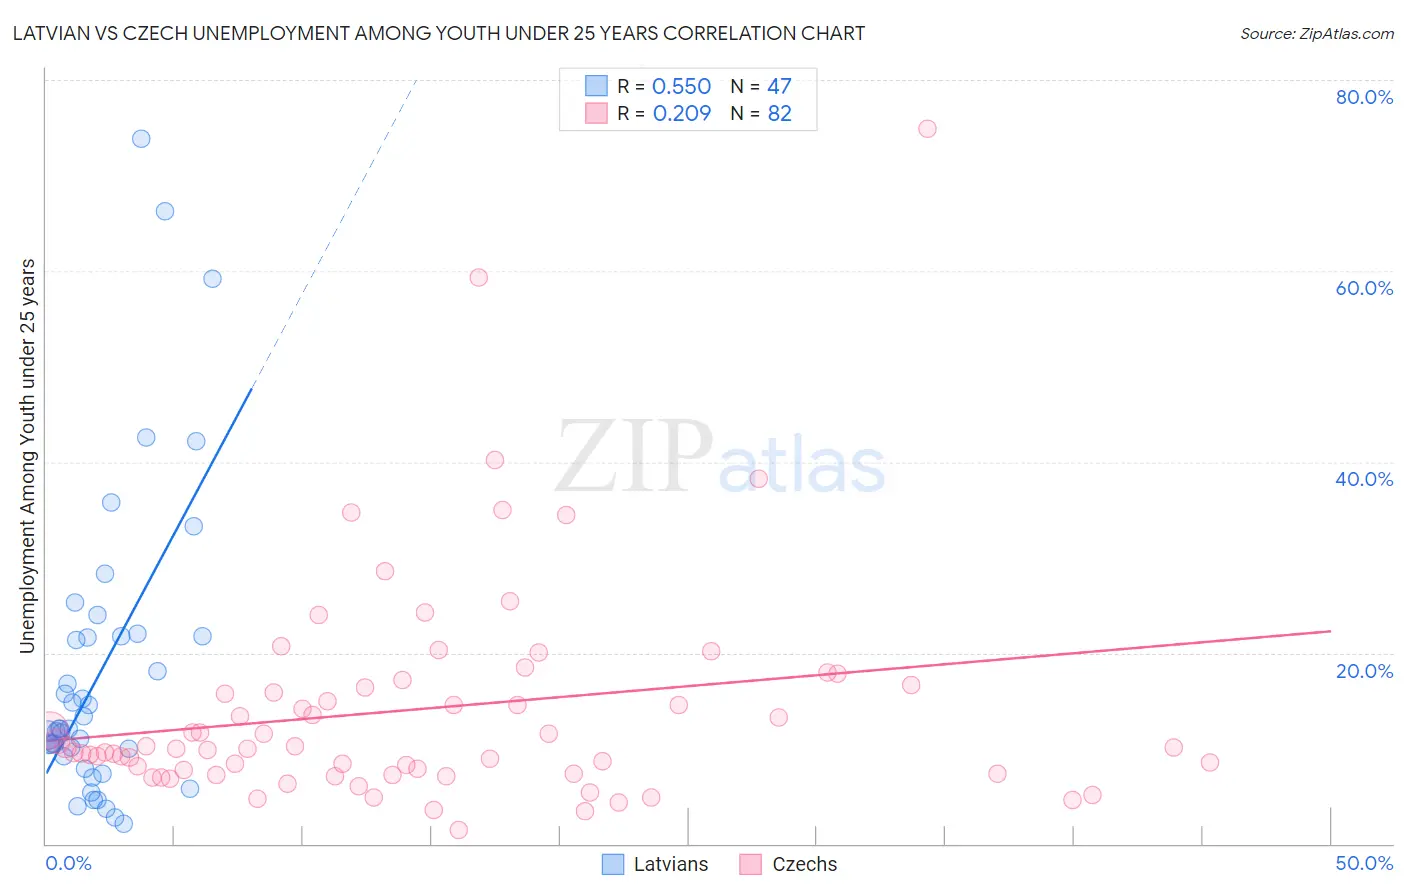
Latvian vs Czech Unemployment Among Youth under 25 years Correlation Chart

The statistical analysis conducted on geographies consisting of 218,853,082 people shows a substantial positive correlation between the proportion of Latvians and unemployment rate among youth under the age of 25 in the United States with a correlation coefficient (R) of 0.550 and weighted average of 11.0%. Similarly, the statistical analysis conducted on geographies consisting of 471,540,458 people shows a weak positive correlation between the proportion of Czechs and unemployment rate among youth under the age of 25 in the United States with a correlation coefficient (R) of 0.209 and weighted average of 10.3%, a difference of 7.3%.
Latvian vs Czech Unemployment Among Youth under 25 years

Unemployment Among Youth under 25 years Correlation Summary

MeasurementLatvianCzech
Minimum2.1%1.4%
Maximum73.8%74.9%
Range71.7%73.5%
Mean18.2%14.1%
Median12.1%10.1%
Interquartile 25% (IQ1)9.1%7.4%
Interquartile 75% (IQ3)21.8%16.3%
Interquartile Range (IQR)12.7%9.0%
Standard Deviation (Sample)16.0%11.8%
Standard Deviation (Population)15.8%11.7%

Similar Demographics by Unemployment Among Youth under 25 years

Demographics Similar to Latvians by Unemployment Among Youth under 25 years

In terms of unemployment among youth under 25 years, the demographic groups most similar to Latvians are Serbian (11.0%, a difference of 0.020%), Ottawa (11.1%, a difference of 0.090%), Mongolian (11.1%, a difference of 0.17%), Irish (11.1%, a difference of 0.17%), and Immigrants from Saudi Arabia (11.1%, a difference of 0.20%).
DemographicsRating | RankUnemployment Among Youth under 25 years
Bulgarians
99.6
/100
|
#45
Exceptional
10.9%
Tongans
99.6
/100
|
#46
Exceptional
10.9%
Australians
99.6
/100
|
#47
Exceptional
10.9%
Poles
99.3
/100
|
#48
Exceptional
11.0%
Thais
99.3
/100
|
#49
Exceptional
11.0%
Czechoslovakians
99.2
/100
|
#50
Exceptional
11.0%
Serbians
99.0
/100
|
#51
Exceptional
11.0%
Latvians
99.0
/100
|
#52
Exceptional
11.0%
Ottawa
99.0
/100
|
#53
Exceptional
11.1%
Mongolians
98.9
/100
|
#54
Exceptional
11.1%
Irish
98.9
/100
|
#55
Exceptional
11.1%
Immigrants | Saudi Arabia
98.8
/100
|
#56
Exceptional
11.1%
Immigrants | Eritrea
98.8
/100
|
#57
Exceptional
11.1%
Scotch-Irish
98.8
/100
|
#58
Exceptional
11.1%
Immigrants | Eastern Africa
98.7
/100
|
#59
Exceptional
11.1%

Demographics Similar to Czechs by Unemployment Among Youth under 25 years

In terms of unemployment among youth under 25 years, the demographic groups most similar to Czechs are Danish (10.3%, a difference of 0.16%), Swedish (10.4%, a difference of 0.91%), Zimbabwean (10.2%, a difference of 1.1%), Immigrants from Venezuela (10.5%, a difference of 1.7%), and German (10.5%, a difference of 2.1%).
DemographicsRating | RankUnemployment Among Youth under 25 years
Norwegians
100.0
/100
|
#1
Exceptional
9.8%
Immigrants | Cuba
100.0
/100
|
#2
Exceptional
10.0%
Luxembourgers
100.0
/100
|
#3
Exceptional
10.0%
Zimbabweans
100.0
/100
|
#4
Exceptional
10.2%
Czechs
100.0
/100
|
#5
Exceptional
10.3%
Danes
100.0
/100
|
#6
Exceptional
10.3%
Swedes
100.0
/100
|
#7
Exceptional
10.4%
Immigrants | Venezuela
100.0
/100
|
#8
Exceptional
10.5%
Germans
100.0
/100
|
#9
Exceptional
10.5%
Immigrants | Somalia
100.0
/100
|
#10
Exceptional
10.5%
Scandinavians
100.0
/100
|
#11
Exceptional
10.5%
Immigrants | Sudan
100.0
/100
|
#12
Exceptional
10.5%
Indonesians
100.0
/100
|
#13
Exceptional
10.6%
Cubans
100.0
/100
|
#14
Exceptional
10.6%
Sudanese
100.0
/100
|
#15
Exceptional
10.6%