Latvian vs British West Indian Unemployment Among Women with Children Under 6 years

COMPARE

Latvian
Race
Ancestry
AfghanAfricanAlaska NativeAlaskan AthabascanAlbanianAleutAlsatianAmericanApacheArabArapahoArgentineanArmenianAssyrian/Chaldean/SyriacAustralianAustrianBahamianBangladeshiBarbadianBasqueBelgianBelizeanBermudanBhutaneseBlackfeetBolivianBrazilianBritishBulgarianBurmeseCajunCambodianCanadianCape VerdeanCarpatho RusynCelticCentral AmericanCentral American IndianCherokeeCheyenneChickasawChileanChineseChippewaChoctawColombianColvilleComancheCosta RicanCreeCreekCroatianCrowCubanCypriotCzechCzechoslovakianDanishDelawareDominicanDutchDutch West IndianEastern EuropeanEcuadorianEgyptianEnglishEstonianEthiopianEuropeanFijianFilipinoFinnishFrenchFrench American IndianFrench CanadianGermanGerman RussianGhanaianGreekGuamanian/ChamorroGuatemalanGuyaneseHaitianHmongHonduranHopiHoumaHungarianIcelanderIndian (Asian)IndonesianInupiatIranianIraqiIrishIroquoisIsraeliItalianJamaicanJapaneseJordanianKenyanKiowaKoreanLaotianLatvianLebaneseLiberianLithuanianLumbeeLuxembourgerMacedonianMalaysianMalteseMarshalleseMenomineeMexicanMexican American IndianMongolianMoroccanNative HawaiianNavajoNepaleseNew ZealanderNicaraguanNigerianNorthern EuropeanNorwegianOkinawanOsageOttawaPaiutePakistaniPalestinianPanamanianParaguayanPennsylvania GermanPeruvianPimaPolishPortuguesePotawatomiPuebloPuerto RicanPuget Sound SalishRomanianRussianSalvadoranSamoanScandinavianScotch-IrishScottishSeminoleSenegaleseSerbianShoshoneSierra LeoneanSiouxSlavicSlovakSloveneSomaliSouth AfricanSouth AmericanSouth American IndianSoviet UnionSpaniardSpanishSpanish AmericanSpanish American IndianSri LankanSubsaharan AfricanSudaneseSwedishSwissSyrianTaiwaneseThaiTlingit-HaidaTohono O'OdhamTonganTrinidadian and TobagonianTsimshianTurkishU.S. Virgin IslanderUgandanUkrainianUruguayanUteVenezuelanVietnameseWelshWest IndianYakamaYaquiYugoslavianYumanYup'ikZimbabwean
Immigration
NonimmigrantsImmigrantsAfghanistanAfricaAlbaniaArgentinaArmeniaAsiaAustraliaAustriaBahamasBangladeshBarbadosBelarusBelgiumBelizeBoliviaBosnia and HerzegovinaBrazilBulgariaBurma/MyanmarCabo VerdeCambodiaCameroonCanadaCaribbeanCentral AmericaChileChinaColombiaCongoCosta RicaCroatiaCubaCzechoslovakiaDenmarkDominicaDominican RepublicEastern AfricaEastern AsiaEastern EuropeEcuadorEgyptEl SalvadorEnglandEritreaEthiopiaEuropeFijiFranceGermanyGhanaGreeceGrenadaGuatemalaGuyanaHaitiHondurasHong KongHungaryIndiaIndonesiaIranIraqIrelandIsraelItalyJamaicaJapanJordanKazakhstanKenyaKoreaKuwaitLaosLatin AmericaLatviaLebanonLiberiaLithuaniaMalaysiaMexicoMicronesiaMiddle AfricaMoldovaMoroccoNepalNetherlandsNicaraguaNigeriaNorth AmericaNorth MacedoniaNorthern AfricaNorthern EuropeNorwayOceaniaPakistanPanamaPeruPhilippinesPolandPortugalRomaniaRussiaSaudi ArabiaScotlandSenegalSerbiaSierra LeoneSingaporeSomaliaSouth AfricaSouth AmericaSouth Central AsiaSouth Eastern AsiaSouthern EuropeSpainSri LankaSt. Vincent and the GrenadinesSudanSwedenSwitzerlandSyriaTaiwanThailandTrinidad and TobagoTurkeyUgandaUkraineUruguayUzbekistanVenezuelaVietnamWest IndiesWestern AfricaWestern AsiaWestern EuropeYemenZaireZimbabweAzores
British West Indian
Race
Ancestry
AfghanAfricanAlaska NativeAlaskan AthabascanAlbanianAleutAlsatianAmericanApacheArabArapahoArgentineanArmenianAssyrian/Chaldean/SyriacAustralianAustrianBahamianBangladeshiBarbadianBasqueBelgianBelizeanBermudanBhutaneseBlackfeetBolivianBrazilianBritishBritish West IndianBulgarianBurmeseCajunCambodianCanadianCape VerdeanCarpatho RusynCelticCentral AmericanCentral American IndianCherokeeCheyenneChickasawChileanChineseChippewaChoctawColombianColvilleComancheCosta RicanCreeCreekCroatianCrowCubanCypriotCzechCzechoslovakianDanishDelawareDominicanDutchDutch West IndianEastern EuropeanEcuadorianEgyptianEnglishEstonianEthiopianEuropeanFijianFilipinoFinnishFrenchFrench American IndianFrench CanadianGermanGerman RussianGhanaianGreekGuamanian/ChamorroGuatemalanGuyaneseHaitianHmongHonduranHopiHoumaHungarianIcelanderIndian (Asian)IndonesianInupiatIranianIraqiIrishIroquoisIsraeliItalianJamaicanJapaneseJordanianKenyanKiowaKoreanLaotianLebaneseLiberianLithuanianLumbeeLuxembourgerMacedonianMalaysianMalteseMarshalleseMenomineeMexicanMexican American IndianMongolianMoroccanNative HawaiianNavajoNepaleseNew ZealanderNicaraguanNigerianNorthern EuropeanNorwegianOkinawanOsageOttawaPaiutePakistaniPalestinianPanamanianParaguayanPennsylvania GermanPeruvianPimaPolishPortuguesePotawatomiPuebloPuerto RicanPuget Sound SalishRomanianRussianSalvadoranSamoanScandinavianScotch-IrishScottishSeminoleSenegaleseSerbianShoshoneSierra LeoneanSiouxSlavicSlovakSloveneSomaliSouth AfricanSouth AmericanSouth American IndianSoviet UnionSpaniardSpanishSpanish AmericanSpanish American IndianSri LankanSubsaharan AfricanSudaneseSwedishSwissSyrianTaiwaneseThaiTlingit-HaidaTohono O'OdhamTonganTrinidadian and TobagonianTsimshianTurkishU.S. Virgin IslanderUgandanUkrainianUruguayanUteVenezuelanVietnameseWelshWest IndianYakamaYaquiYugoslavianYumanYup'ikZimbabwean
Immigration
NonimmigrantsImmigrantsAfghanistanAfricaAlbaniaArgentinaArmeniaAsiaAustraliaAustriaBahamasBangladeshBarbadosBelarusBelgiumBelizeBoliviaBosnia and HerzegovinaBrazilBulgariaBurma/MyanmarCabo VerdeCambodiaCameroonCanadaCaribbeanCentral AmericaChileChinaColombiaCongoCosta RicaCroatiaCubaCzechoslovakiaDenmarkDominicaDominican RepublicEastern AfricaEastern AsiaEastern EuropeEcuadorEgyptEl SalvadorEnglandEritreaEthiopiaEuropeFijiFranceGermanyGhanaGreeceGrenadaGuatemalaGuyanaHaitiHondurasHong KongHungaryIndiaIndonesiaIranIraqIrelandIsraelItalyJamaicaJapanJordanKazakhstanKenyaKoreaKuwaitLaosLatin AmericaLatviaLebanonLiberiaLithuaniaMalaysiaMexicoMicronesiaMiddle AfricaMoldovaMoroccoNepalNetherlandsNicaraguaNigeriaNorth AmericaNorth MacedoniaNorthern AfricaNorthern EuropeNorwayOceaniaPakistanPanamaPeruPhilippinesPolandPortugalRomaniaRussiaSaudi ArabiaScotlandSenegalSerbiaSierra LeoneSingaporeSomaliaSouth AfricaSouth AmericaSouth Central AsiaSouth Eastern AsiaSouthern EuropeSpainSri LankaSt. Vincent and the GrenadinesSudanSwedenSwitzerlandSyriaTaiwanThailandTrinidad and TobagoTurkeyUgandaUkraineUruguayUzbekistanVenezuelaVietnamWest IndiesWestern AfricaWestern AsiaWestern EuropeYemenZaireZimbabweAzores
Unemployment Among Women with Children Under 6 years
Income
Poverty
Unemployment
Labor Participation
Family Structure
Vehicle Availability
Education Level
Disability

Unemployment Among Women with Children Under 6 years Comparison

Latvians

British West Indians

Exceptional
Tragic
6.8%
UNEMPLOYMENT AMONG WOMEN WITH CHILDREN UNDER 6 YEARS
99.9/ 100
METRIC RATING
46th/ 347
METRIC RANK
8.3%
UNEMPLOYMENT AMONG WOMEN WITH CHILDREN UNDER 6 YEARS
0.5/ 100
METRIC RATING
257th/ 347
METRIC RANK

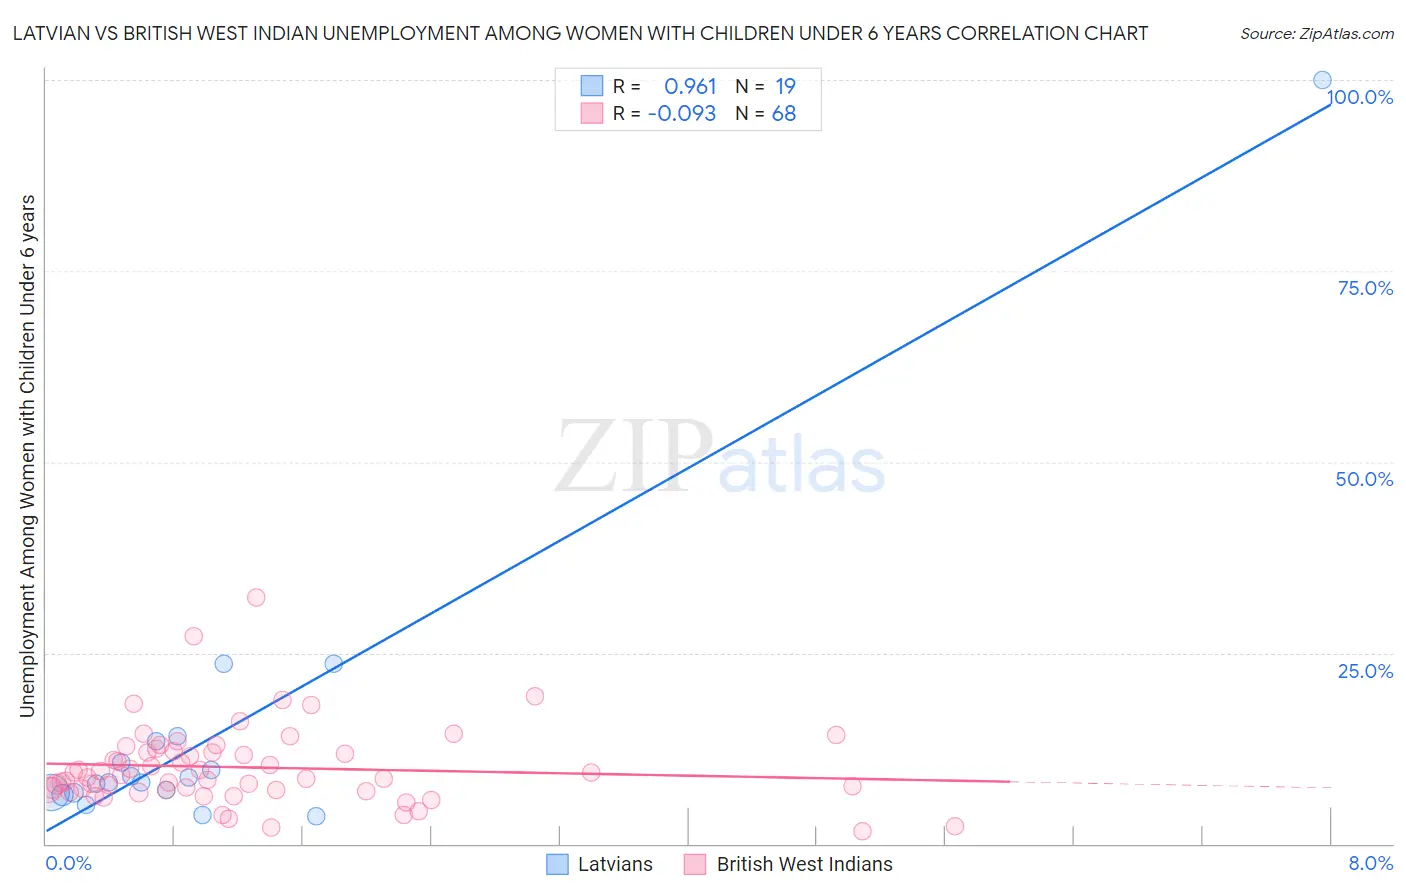
Latvian vs British West Indian Unemployment Among Women with Children Under 6 years Correlation Chart

The statistical analysis conducted on geographies consisting of 177,379,958 people shows a perfect positive correlation between the proportion of Latvians and unemployment rate among women with children under the age of 6 in the United States with a correlation coefficient (R) of 0.961 and weighted average of 6.8%. Similarly, the statistical analysis conducted on geographies consisting of 134,064,740 people shows a slight negative correlation between the proportion of British West Indians and unemployment rate among women with children under the age of 6 in the United States with a correlation coefficient (R) of -0.093 and weighted average of 8.3%, a difference of 22.9%.
Latvian vs British West Indian Unemployment Among Women with Children Under 6 years

Unemployment Among Women with Children Under 6 years Correlation Summary

MeasurementLatvianBritish West Indian
Minimum3.6%1.6%
Maximum100.0%32.3%
Range96.4%30.7%
Mean14.5%10.0%
Median8.0%8.8%
Interquartile 25% (IQ1)6.7%7.0%
Interquartile 75% (IQ3)13.4%12.1%
Interquartile Range (IQR)6.7%5.1%
Standard Deviation (Sample)21.4%5.3%
Standard Deviation (Population)20.9%5.2%

Similar Demographics by Unemployment Among Women with Children Under 6 years

Demographics Similar to Latvians by Unemployment Among Women with Children Under 6 years

In terms of unemployment among women with children under 6 years, the demographic groups most similar to Latvians are Immigrants from Asia (6.8%, a difference of 0.17%), Immigrants from Switzerland (6.8%, a difference of 0.20%), Immigrants from Australia (6.8%, a difference of 0.24%), Immigrants from Nepal (6.8%, a difference of 0.26%), and Immigrants from Ireland (6.8%, a difference of 0.26%).
DemographicsRating | RankUnemployment Among Women with Children Under 6 years
Immigrants | Russia
100.0
/100
|
#39
Exceptional
6.7%
Asians
100.0
/100
|
#40
Exceptional
6.7%
Immigrants | Indonesia
99.9
/100
|
#41
Exceptional
6.7%
Immigrants | Cuba
99.9
/100
|
#42
Exceptional
6.7%
Bhutanese
99.9
/100
|
#43
Exceptional
6.7%
Iranians
99.9
/100
|
#44
Exceptional
6.7%
Immigrants | Australia
99.9
/100
|
#45
Exceptional
6.8%
Latvians
99.9
/100
|
#46
Exceptional
6.8%
Immigrants | Asia
99.9
/100
|
#47
Exceptional
6.8%
Immigrants | Switzerland
99.9
/100
|
#48
Exceptional
6.8%
Immigrants | Nepal
99.9
/100
|
#49
Exceptional
6.8%
Immigrants | Ireland
99.9
/100
|
#50
Exceptional
6.8%
Ethiopians
99.9
/100
|
#51
Exceptional
6.8%
Immigrants | Iran
99.9
/100
|
#52
Exceptional
6.8%
Chinese
99.9
/100
|
#53
Exceptional
6.8%

Demographics Similar to British West Indians by Unemployment Among Women with Children Under 6 years

In terms of unemployment among women with children under 6 years, the demographic groups most similar to British West Indians are Immigrants from Ghana (8.3%, a difference of 0.020%), Celtic (8.3%, a difference of 0.26%), Immigrants from Portugal (8.3%, a difference of 0.27%), Barbadian (8.3%, a difference of 0.31%), and Immigrants from Caribbean (8.3%, a difference of 0.57%).
DemographicsRating | RankUnemployment Among Women with Children Under 6 years
Nigerians
1.1
/100
|
#250
Tragic
8.2%
Guyanese
1.0
/100
|
#251
Tragic
8.2%
Ghanaians
1.0
/100
|
#252
Tragic
8.2%
Immigrants | Guyana
0.8
/100
|
#253
Tragic
8.2%
Immigrants | Caribbean
0.7
/100
|
#254
Tragic
8.3%
Immigrants | Portugal
0.6
/100
|
#255
Tragic
8.3%
Celtics
0.6
/100
|
#256
Tragic
8.3%
British West Indians
0.5
/100
|
#257
Tragic
8.3%
Immigrants | Ghana
0.5
/100
|
#258
Tragic
8.3%
Barbadians
0.4
/100
|
#259
Tragic
8.3%
Whites/Caucasians
0.3
/100
|
#260
Tragic
8.4%
Immigrants | Liberia
0.3
/100
|
#261
Tragic
8.4%
West Indians
0.3
/100
|
#262
Tragic
8.4%
Scotch-Irish
0.3
/100
|
#263
Tragic
8.4%
Hondurans
0.3
/100
|
#264
Tragic
8.4%