Korean vs Alaska Native Unemployment Among Ages 30 to 34 years

COMPARE

Korean
Race
Ancestry
AfghanAfricanAlaskan AthabascanAlbanianAleutAlsatianAmericanApacheArabArapahoArgentineanArmenianAssyrian/Chaldean/SyriacAustralianAustrianBahamianBangladeshiBarbadianBasqueBelgianBelizeanBermudanBhutaneseBlackfeetBolivianBrazilianBritishBritish West IndianBulgarianBurmeseCajunCambodianCanadianCape VerdeanCarpatho RusynCelticCentral AmericanCentral American IndianCherokeeCheyenneChickasawChileanChineseChippewaChoctawColombianColvilleComancheCosta RicanCreeCreekCroatianCrowCubanCypriotCzechCzechoslovakianDanishDelawareDominicanDutchDutch West IndianEastern EuropeanEcuadorianEgyptianEnglishEstonianEthiopianEuropeanFijianFilipinoFinnishFrenchFrench American IndianFrench CanadianGermanGerman RussianGhanaianGreekGuamanian/ChamorroGuatemalanGuyaneseHaitianHmongHonduranHopiHoumaHungarianIcelanderIndian (Asian)IndonesianInupiatIranianIraqiIrishIroquoisIsraeliItalianJamaicanJapaneseJordanianKenyanKiowaKoreanLaotianLatvianLebaneseLiberianLithuanianLumbeeLuxembourgerMacedonianMalaysianMalteseMarshalleseMenomineeMexicanMexican American IndianMongolianMoroccanNative HawaiianNavajoNepaleseNew ZealanderNicaraguanNigerianNorthern EuropeanNorwegianOkinawanOsageOttawaPaiutePakistaniPalestinianPanamanianParaguayanPennsylvania GermanPeruvianPimaPolishPortuguesePotawatomiPuebloPuerto RicanPuget Sound SalishRomanianRussianSalvadoranSamoanScandinavianScotch-IrishScottishSeminoleSenegaleseSerbianShoshoneSierra LeoneanSiouxSlavicSlovakSloveneSomaliSouth AfricanSouth AmericanSouth American IndianSoviet UnionSpaniardSpanishSpanish AmericanSpanish American IndianSri LankanSubsaharan AfricanSudaneseSwedishSwissSyrianTaiwaneseThaiTlingit-HaidaTohono O'OdhamTonganTrinidadian and TobagonianTsimshianTurkishU.S. Virgin IslanderUgandanUkrainianUruguayanUteVenezuelanVietnameseWelshWest IndianYakamaYaquiYugoslavianYumanYup'ikZimbabwean
Immigration
NonimmigrantsImmigrantsAfghanistanAfricaAlbaniaArgentinaArmeniaAsiaAustraliaAustriaBahamasBangladeshBarbadosBelarusBelgiumBelizeBoliviaBosnia and HerzegovinaBrazilBulgariaBurma/MyanmarCabo VerdeCambodiaCameroonCanadaCaribbeanCentral AmericaChileChinaColombiaCongoCosta RicaCroatiaCubaCzechoslovakiaDenmarkDominicaDominican RepublicEastern AfricaEastern AsiaEastern EuropeEcuadorEgyptEl SalvadorEnglandEritreaEthiopiaEuropeFijiFranceGermanyGhanaGreeceGrenadaGuatemalaGuyanaHaitiHondurasHong KongHungaryIndiaIndonesiaIranIraqIrelandIsraelItalyJamaicaJapanJordanKazakhstanKenyaKoreaKuwaitLaosLatin AmericaLatviaLebanonLiberiaLithuaniaMalaysiaMexicoMicronesiaMiddle AfricaMoldovaMoroccoNepalNetherlandsNicaraguaNigeriaNorth AmericaNorth MacedoniaNorthern AfricaNorthern EuropeNorwayOceaniaPakistanPanamaPeruPhilippinesPolandPortugalRomaniaRussiaSaudi ArabiaScotlandSenegalSerbiaSierra LeoneSingaporeSomaliaSouth AfricaSouth AmericaSouth Central AsiaSouth Eastern AsiaSouthern EuropeSpainSri LankaSt. Vincent and the GrenadinesSudanSwedenSwitzerlandSyriaTaiwanThailandTrinidad and TobagoTurkeyUgandaUkraineUruguayUzbekistanVenezuelaVietnamWest IndiesWestern AfricaWestern AsiaWestern EuropeYemenZaireZimbabweAzores
Alaska Native
Race
Ancestry
AfghanAfricanAlaska NativeAlaskan AthabascanAlbanianAleutAlsatianAmericanApacheArabArapahoArgentineanArmenianAssyrian/Chaldean/SyriacAustralianAustrianBahamianBangladeshiBarbadianBasqueBelgianBelizeanBermudanBhutaneseBlackfeetBolivianBrazilianBritishBritish West IndianBulgarianBurmeseCajunCambodianCanadianCape VerdeanCarpatho RusynCelticCentral AmericanCentral American IndianCherokeeCheyenneChickasawChileanChineseChippewaChoctawColombianColvilleComancheCosta RicanCreeCreekCroatianCrowCubanCypriotCzechCzechoslovakianDanishDelawareDominicanDutchDutch West IndianEastern EuropeanEcuadorianEgyptianEnglishEstonianEthiopianEuropeanFijianFilipinoFinnishFrenchFrench American IndianFrench CanadianGermanGerman RussianGhanaianGreekGuamanian/ChamorroGuatemalanGuyaneseHaitianHmongHonduranHopiHoumaHungarianIcelanderIndian (Asian)IndonesianInupiatIranianIraqiIrishIroquoisIsraeliItalianJamaicanJapaneseJordanianKenyanKiowaLaotianLatvianLebaneseLiberianLithuanianLumbeeLuxembourgerMacedonianMalaysianMalteseMarshalleseMenomineeMexicanMexican American IndianMongolianMoroccanNative HawaiianNavajoNepaleseNew ZealanderNicaraguanNigerianNorthern EuropeanNorwegianOkinawanOsageOttawaPaiutePakistaniPalestinianPanamanianParaguayanPennsylvania GermanPeruvianPimaPolishPortuguesePotawatomiPuebloPuerto RicanPuget Sound SalishRomanianRussianSalvadoranSamoanScandinavianScotch-IrishScottishSeminoleSenegaleseSerbianShoshoneSierra LeoneanSiouxSlavicSlovakSloveneSomaliSouth AfricanSouth AmericanSouth American IndianSoviet UnionSpaniardSpanishSpanish AmericanSpanish American IndianSri LankanSubsaharan AfricanSudaneseSwedishSwissSyrianTaiwaneseThaiTlingit-HaidaTohono O'OdhamTonganTrinidadian and TobagonianTsimshianTurkishU.S. Virgin IslanderUgandanUkrainianUruguayanUteVenezuelanVietnameseWelshWest IndianYakamaYaquiYugoslavianYumanYup'ikZimbabwean
Immigration
NonimmigrantsImmigrantsAfghanistanAfricaAlbaniaArgentinaArmeniaAsiaAustraliaAustriaBahamasBangladeshBarbadosBelarusBelgiumBelizeBoliviaBosnia and HerzegovinaBrazilBulgariaBurma/MyanmarCabo VerdeCambodiaCameroonCanadaCaribbeanCentral AmericaChileChinaColombiaCongoCosta RicaCroatiaCubaCzechoslovakiaDenmarkDominicaDominican RepublicEastern AfricaEastern AsiaEastern EuropeEcuadorEgyptEl SalvadorEnglandEritreaEthiopiaEuropeFijiFranceGermanyGhanaGreeceGrenadaGuatemalaGuyanaHaitiHondurasHong KongHungaryIndiaIndonesiaIranIraqIrelandIsraelItalyJamaicaJapanJordanKazakhstanKenyaKoreaKuwaitLaosLatin AmericaLatviaLebanonLiberiaLithuaniaMalaysiaMexicoMicronesiaMiddle AfricaMoldovaMoroccoNepalNetherlandsNicaraguaNigeriaNorth AmericaNorth MacedoniaNorthern AfricaNorthern EuropeNorwayOceaniaPakistanPanamaPeruPhilippinesPolandPortugalRomaniaRussiaSaudi ArabiaScotlandSenegalSerbiaSierra LeoneSingaporeSomaliaSouth AfricaSouth AmericaSouth Central AsiaSouth Eastern AsiaSouthern EuropeSpainSri LankaSt. Vincent and the GrenadinesSudanSwedenSwitzerlandSyriaTaiwanThailandTrinidad and TobagoTurkeyUgandaUkraineUruguayUzbekistanVenezuelaVietnamWest IndiesWestern AfricaWestern AsiaWestern EuropeYemenZaireZimbabweAzores
Unemployment Among Ages 30 to 34 years
Income
Poverty
Unemployment
Labor Participation
Family Structure
Vehicle Availability
Education Level
Disability

Unemployment Among Ages 30 to 34 years Comparison

Koreans

Alaska Natives

Fair
Tragic
5.6%
UNEMPLOYMENT AMONG AGES 30 TO 34 YEARS
20.7/ 100
METRIC RATING
203rd/ 347
METRIC RANK
8.5%
UNEMPLOYMENT AMONG AGES 30 TO 34 YEARS
0.0/ 100
METRIC RATING
334th/ 347
METRIC RANK

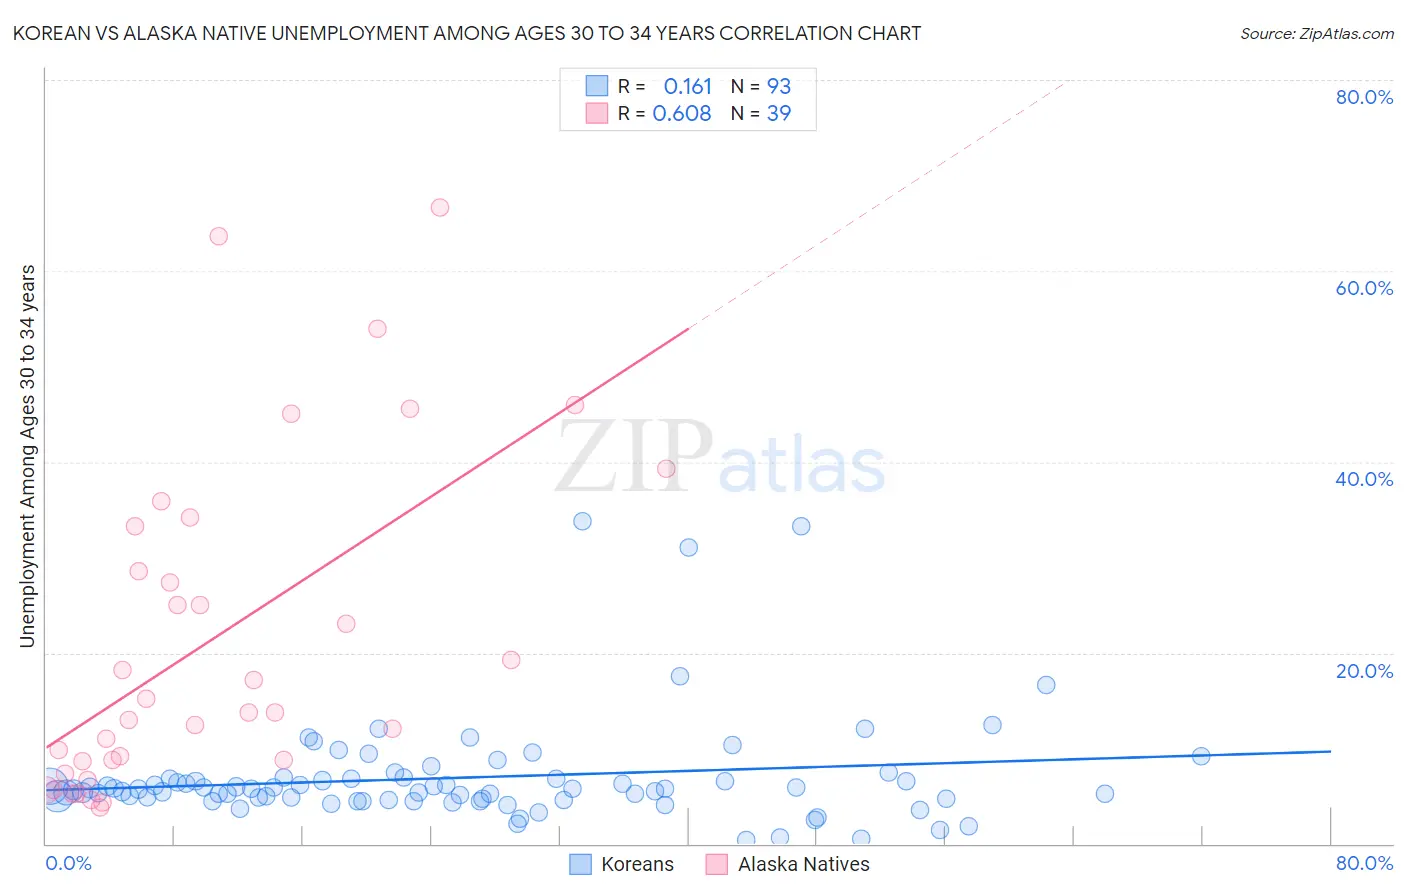
Korean vs Alaska Native Unemployment Among Ages 30 to 34 years Correlation Chart

The statistical analysis conducted on geographies consisting of 466,228,807 people shows a poor positive correlation between the proportion of Koreans and unemployment rate among population between the ages 30 and 34 in the United States with a correlation coefficient (R) of 0.161 and weighted average of 5.6%. Similarly, the statistical analysis conducted on geographies consisting of 75,749,342 people shows a significant positive correlation between the proportion of Alaska Natives and unemployment rate among population between the ages 30 and 34 in the United States with a correlation coefficient (R) of 0.608 and weighted average of 8.5%, a difference of 51.9%.
Korean vs Alaska Native Unemployment Among Ages 30 to 34 years

Unemployment Among Ages 30 to 34 years Correlation Summary

MeasurementKoreanAlaska Native
Minimum0.40%3.8%
Maximum33.8%66.7%
Range33.4%62.9%
Mean6.9%21.3%
Median5.8%13.8%
Interquartile 25% (IQ1)4.6%8.7%
Interquartile 75% (IQ3)6.8%33.3%
Interquartile Range (IQR)2.2%24.6%
Standard Deviation (Sample)5.6%17.2%
Standard Deviation (Population)5.5%16.9%

Similar Demographics by Unemployment Among Ages 30 to 34 years

Demographics Similar to Koreans by Unemployment Among Ages 30 to 34 years

In terms of unemployment among ages 30 to 34 years, the demographic groups most similar to Koreans are Immigrants from Germany (5.6%, a difference of 0.22%), Immigrants from Cameroon (5.6%, a difference of 0.25%), South American Indian (5.6%, a difference of 0.36%), Immigrants from Southern Europe (5.6%, a difference of 0.49%), and Nicaraguan (5.6%, a difference of 0.56%).
DemographicsRating | RankUnemployment Among Ages 30 to 34 years
Immigrants | South America
29.8
/100
|
#196
Fair
5.5%
Immigrants | Nicaragua
28.9
/100
|
#197
Fair
5.5%
Immigrants | Afghanistan
27.2
/100
|
#198
Fair
5.6%
Nicaraguans
26.6
/100
|
#199
Fair
5.6%
Immigrants | Southern Europe
25.8
/100
|
#200
Fair
5.6%
South American Indians
24.4
/100
|
#201
Fair
5.6%
Immigrants | Germany
22.9
/100
|
#202
Fair
5.6%
Koreans
20.7
/100
|
#203
Fair
5.6%
Immigrants | Cameroon
18.4
/100
|
#204
Poor
5.6%
Immigrants | Costa Rica
14.4
/100
|
#205
Poor
5.6%
Alsatians
14.3
/100
|
#206
Poor
5.6%
Israelis
12.8
/100
|
#207
Poor
5.6%
Immigrants | Philippines
11.5
/100
|
#208
Poor
5.7%
French
10.8
/100
|
#209
Poor
5.7%
Whites/Caucasians
9.2
/100
|
#210
Tragic
5.7%

Demographics Similar to Alaska Natives by Unemployment Among Ages 30 to 34 years

In terms of unemployment among ages 30 to 34 years, the demographic groups most similar to Alaska Natives are Pueblo (8.3%, a difference of 2.7%), Native/Alaskan (8.2%, a difference of 3.1%), Puerto Rican (8.9%, a difference of 4.5%), Sioux (8.0%, a difference of 5.8%), and Colville (9.0%, a difference of 6.5%).
DemographicsRating | RankUnemployment Among Ages 30 to 34 years
Immigrants | Dominican Republic
0.0
/100
|
#327
Tragic
7.7%
Chippewa
0.0
/100
|
#328
Tragic
7.8%
Cheyenne
0.0
/100
|
#329
Tragic
7.8%
Shoshone
0.0
/100
|
#330
Tragic
7.9%
Sioux
0.0
/100
|
#331
Tragic
8.0%
Natives/Alaskans
0.0
/100
|
#332
Tragic
8.2%
Pueblo
0.0
/100
|
#333
Tragic
8.3%
Alaska Natives
0.0
/100
|
#334
Tragic
8.5%
Puerto Ricans
0.0
/100
|
#335
Tragic
8.9%
Colville
0.0
/100
|
#336
Tragic
9.0%
Pima
0.0
/100
|
#337
Tragic
9.6%
Yakama
0.0
/100
|
#338
Tragic
9.8%
Tohono O'odham
0.0
/100
|
#339
Tragic
9.8%
Crow
0.0
/100
|
#340
Tragic
10.3%
Navajo
0.0
/100
|
#341
Tragic
10.6%