Cajun vs Alaska Native Unemployment Among Ages 30 to 34 years
COMPARE
Cajun
Alaska Native
Unemployment Among Ages 30 to 34 years
Unemployment Among Ages 30 to 34 years Comparison
Cajuns
Alaska Natives
6.7%
UNEMPLOYMENT AMONG AGES 30 TO 34 YEARS
0.0/ 100
METRIC RATING
303rd/ 347
METRIC RANK
8.5%
UNEMPLOYMENT AMONG AGES 30 TO 34 YEARS
0.0/ 100
METRIC RATING
334th/ 347
METRIC RANK
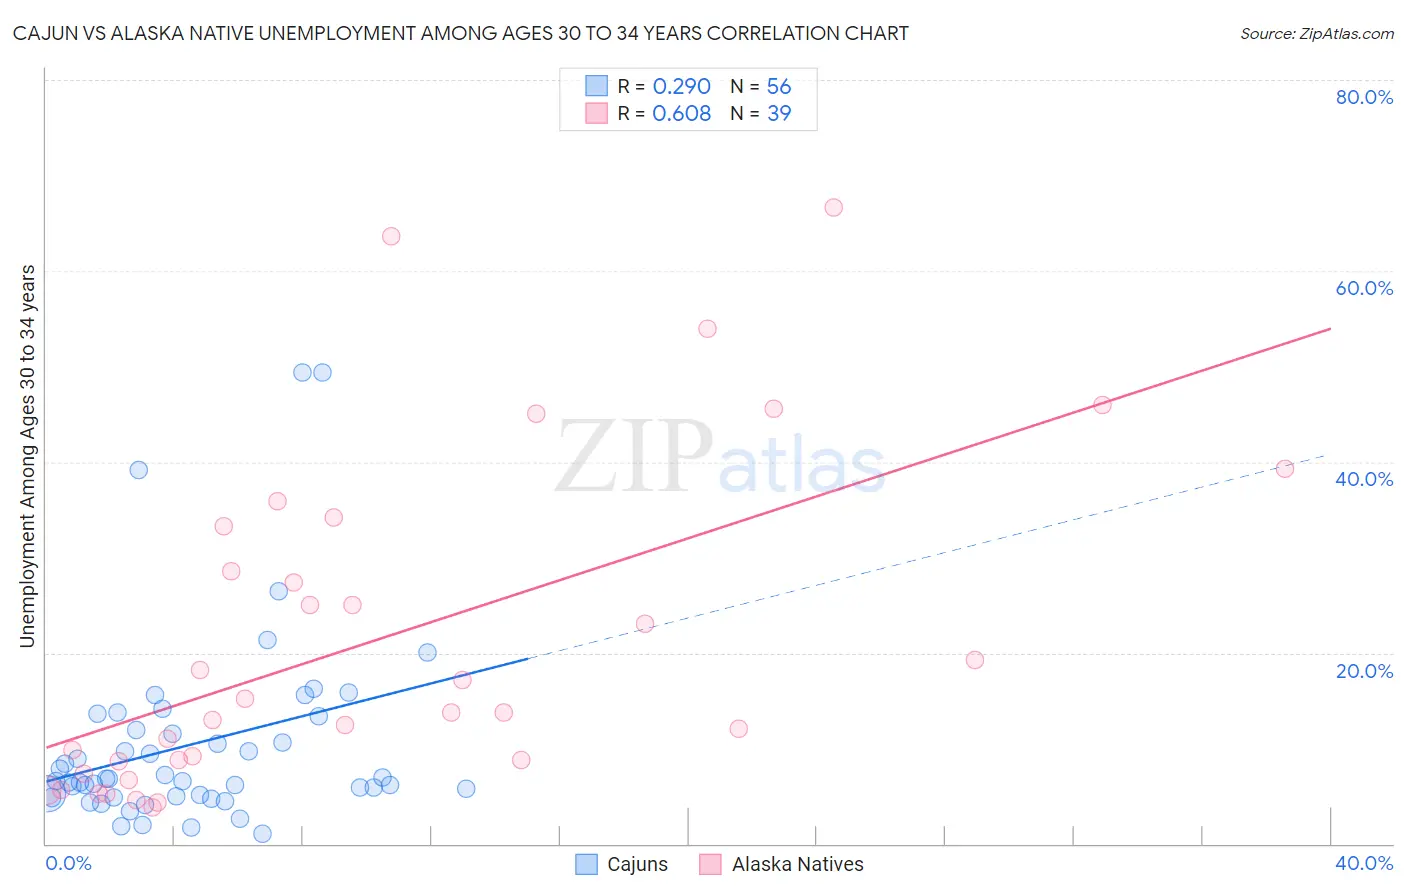
Cajun vs Alaska Native Unemployment Among Ages 30 to 34 years Correlation Chart
The statistical analysis conducted on geographies consisting of 144,402,531 people shows a weak positive correlation between the proportion of Cajuns and unemployment rate among population between the ages 30 and 34 in the United States with a correlation coefficient (R) of 0.290 and weighted average of 6.7%. Similarly, the statistical analysis conducted on geographies consisting of 75,749,342 people shows a significant positive correlation between the proportion of Alaska Natives and unemployment rate among population between the ages 30 and 34 in the United States with a correlation coefficient (R) of 0.608 and weighted average of 8.5%, a difference of 27.3%.
Unemployment Among Ages 30 to 34 years Correlation Summary
| Measurement | Cajun | Alaska Native |
| Minimum | 1.1% | 3.8% |
| Maximum | 49.4% | 66.7% |
| Range | 48.3% | 62.9% |
| Mean | 10.4% | 21.3% |
| Median | 6.7% | 13.8% |
| Interquartile 25% (IQ1) | 5.0% | 8.7% |
| Interquartile 75% (IQ3) | 12.6% | 33.3% |
| Interquartile Range (IQR) | 7.6% | 24.6% |
| Standard Deviation (Sample) | 10.0% | 17.2% |
| Standard Deviation (Population) | 9.9% | 16.9% |
Similar Demographics by Unemployment Among Ages 30 to 34 years
Demographics Similar to Cajuns by Unemployment Among Ages 30 to 34 years
In terms of unemployment among ages 30 to 34 years, the demographic groups most similar to Cajuns are Delaware (6.7%, a difference of 0.19%), Kiowa (6.7%, a difference of 0.42%), Paiute (6.7%, a difference of 0.46%), Belizean (6.6%, a difference of 1.0%), and Bahamian (6.6%, a difference of 1.3%).
| Demographics | Rating | Rank | Unemployment Among Ages 30 to 34 years |
| Immigrants | Jamaica | 0.0 /100 | #296 | Tragic 6.5% |
| Creek | 0.0 /100 | #297 | Tragic 6.6% |
| Immigrants | Barbados | 0.0 /100 | #298 | Tragic 6.6% |
| Dutch West Indians | 0.0 /100 | #299 | Tragic 6.6% |
| Bahamians | 0.0 /100 | #300 | Tragic 6.6% |
| Belizeans | 0.0 /100 | #301 | Tragic 6.6% |
| Delaware | 0.0 /100 | #302 | Tragic 6.7% |
| Cajuns | 0.0 /100 | #303 | Tragic 6.7% |
| Kiowa | 0.0 /100 | #304 | Tragic 6.7% |
| Paiute | 0.0 /100 | #305 | Tragic 6.7% |
| Immigrants | Armenia | 0.0 /100 | #306 | Tragic 6.8% |
| Immigrants | Belize | 0.0 /100 | #307 | Tragic 6.9% |
| Immigrants | Azores | 0.0 /100 | #308 | Tragic 6.9% |
| Immigrants | Grenada | 0.0 /100 | #309 | Tragic 6.9% |
| Immigrants | St. Vincent and the Grenadines | 0.0 /100 | #310 | Tragic 7.0% |
Demographics Similar to Alaska Natives by Unemployment Among Ages 30 to 34 years
In terms of unemployment among ages 30 to 34 years, the demographic groups most similar to Alaska Natives are Pueblo (8.3%, a difference of 2.7%), Native/Alaskan (8.2%, a difference of 3.1%), Puerto Rican (8.9%, a difference of 4.5%), Sioux (8.0%, a difference of 5.8%), and Colville (9.0%, a difference of 6.5%).
| Demographics | Rating | Rank | Unemployment Among Ages 30 to 34 years |
| Immigrants | Dominican Republic | 0.0 /100 | #327 | Tragic 7.7% |
| Chippewa | 0.0 /100 | #328 | Tragic 7.8% |
| Cheyenne | 0.0 /100 | #329 | Tragic 7.8% |
| Shoshone | 0.0 /100 | #330 | Tragic 7.9% |
| Sioux | 0.0 /100 | #331 | Tragic 8.0% |
| Natives/Alaskans | 0.0 /100 | #332 | Tragic 8.2% |
| Pueblo | 0.0 /100 | #333 | Tragic 8.3% |
| Alaska Natives | 0.0 /100 | #334 | Tragic 8.5% |
| Puerto Ricans | 0.0 /100 | #335 | Tragic 8.9% |
| Colville | 0.0 /100 | #336 | Tragic 9.0% |
| Pima | 0.0 /100 | #337 | Tragic 9.6% |
| Yakama | 0.0 /100 | #338 | Tragic 9.8% |
| Tohono O'odham | 0.0 /100 | #339 | Tragic 9.8% |
| Crow | 0.0 /100 | #340 | Tragic 10.3% |
| Navajo | 0.0 /100 | #341 | Tragic 10.6% |