Jordanian vs Yuman Female Unemployment
COMPARE
Jordanian
Yuman
Female Unemployment
Female Unemployment Comparison
Jordanians
Yuman
5.1%
FEMALE UNEMPLOYMENT
90.3/ 100
METRIC RATING
117th/ 347
METRIC RANK
9.6%
FEMALE UNEMPLOYMENT
0.0/ 100
METRIC RATING
345th/ 347
METRIC RANK
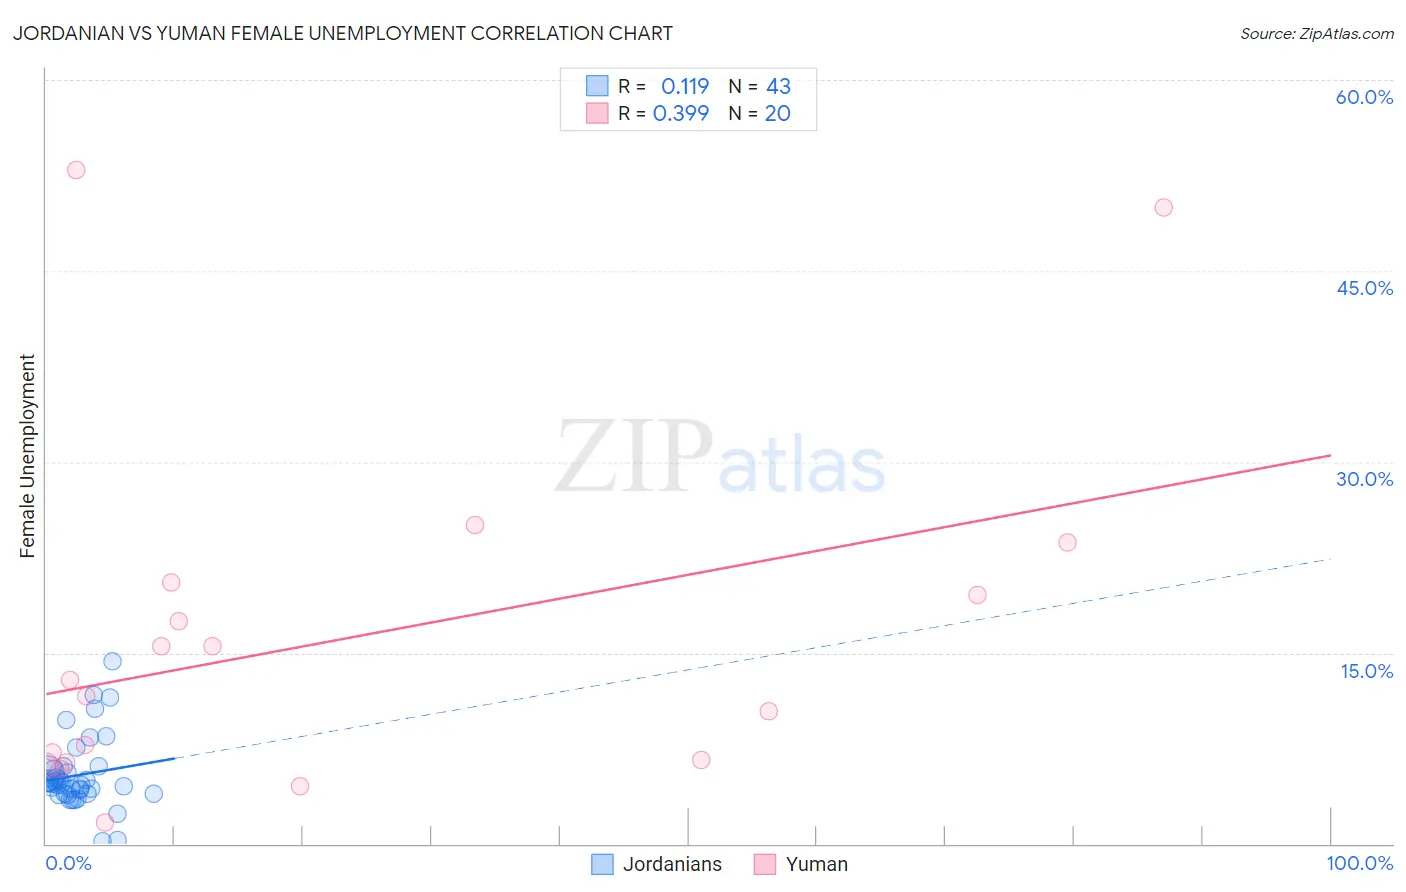
Jordanian vs Yuman Female Unemployment Correlation Chart
The statistical analysis conducted on geographies consisting of 166,280,394 people shows a poor positive correlation between the proportion of Jordanians and unemploymnet rate among females in the United States with a correlation coefficient (R) of 0.119 and weighted average of 5.1%. Similarly, the statistical analysis conducted on geographies consisting of 40,628,844 people shows a mild positive correlation between the proportion of Yuman and unemploymnet rate among females in the United States with a correlation coefficient (R) of 0.399 and weighted average of 9.6%, a difference of 88.7%.
Female Unemployment Correlation Summary
| Measurement | Jordanian | Yuman |
| Minimum | 0.20% | 1.7% |
| Maximum | 14.3% | 52.9% |
| Range | 14.1% | 51.2% |
| Mean | 5.4% | 16.1% |
| Median | 4.8% | 12.2% |
| Interquartile 25% (IQ1) | 3.9% | 6.5% |
| Interquartile 75% (IQ3) | 5.9% | 20.0% |
| Interquartile Range (IQR) | 2.0% | 13.5% |
| Standard Deviation (Sample) | 2.8% | 13.8% |
| Standard Deviation (Population) | 2.8% | 13.4% |
Similar Demographics by Female Unemployment
Demographics Similar to Jordanians by Female Unemployment
In terms of female unemployment, the demographic groups most similar to Jordanians are American (5.1%, a difference of 0.040%), Immigrants from Croatia (5.1%, a difference of 0.060%), Lebanese (5.1%, a difference of 0.12%), Immigrants from Turkey (5.1%, a difference of 0.14%), and Immigrants from Saudi Arabia (5.1%, a difference of 0.18%).
| Demographics | Rating | Rank | Female Unemployment |
| Macedonians | 92.4 /100 | #110 | Exceptional 5.1% |
| Immigrants | Burma/Myanmar | 92.3 /100 | #111 | Exceptional 5.1% |
| Estonians | 92.1 /100 | #112 | Exceptional 5.1% |
| Immigrants | Saudi Arabia | 91.2 /100 | #113 | Exceptional 5.1% |
| Immigrants | Turkey | 91.0 /100 | #114 | Exceptional 5.1% |
| Lebanese | 91.0 /100 | #115 | Exceptional 5.1% |
| Americans | 90.5 /100 | #116 | Exceptional 5.1% |
| Jordanians | 90.3 /100 | #117 | Exceptional 5.1% |
| Immigrants | Croatia | 89.9 /100 | #118 | Excellent 5.1% |
| Immigrants | North Macedonia | 88.3 /100 | #119 | Excellent 5.1% |
| Immigrants | Romania | 88.1 /100 | #120 | Excellent 5.1% |
| Immigrants | Western Europe | 88.1 /100 | #121 | Excellent 5.1% |
| Immigrants | Germany | 87.6 /100 | #122 | Excellent 5.1% |
| Immigrants | South Africa | 87.6 /100 | #123 | Excellent 5.1% |
| Immigrants | Europe | 87.2 /100 | #124 | Excellent 5.1% |
Demographics Similar to Yuman by Female Unemployment
In terms of female unemployment, the demographic groups most similar to Yuman are Pima (9.3%, a difference of 2.8%), Arapaho (8.8%, a difference of 9.1%), Yup'ik (10.9%, a difference of 13.4%), Puerto Rican (8.3%, a difference of 15.0%), and Inupiat (8.2%, a difference of 17.6%).
| Demographics | Rating | Rank | Female Unemployment |
| Menominee | 0.0 /100 | #333 | Tragic 7.0% |
| Immigrants | Armenia | 0.0 /100 | #334 | Tragic 7.1% |
| Dominicans | 0.0 /100 | #335 | Tragic 7.2% |
| Immigrants | Dominican Republic | 0.0 /100 | #336 | Tragic 7.2% |
| Navajo | 0.0 /100 | #337 | Tragic 7.3% |
| Tohono O'odham | 0.0 /100 | #338 | Tragic 7.7% |
| Immigrants | Yemen | 0.0 /100 | #339 | Tragic 7.8% |
| Hopi | 0.0 /100 | #340 | Tragic 8.1% |
| Inupiat | 0.0 /100 | #341 | Tragic 8.2% |
| Puerto Ricans | 0.0 /100 | #342 | Tragic 8.3% |
| Arapaho | 0.0 /100 | #343 | Tragic 8.8% |
| Pima | 0.0 /100 | #344 | Tragic 9.3% |
| Yuman | 0.0 /100 | #345 | Tragic 9.6% |
| Yup'ik | 0.0 /100 | #346 | Tragic 10.9% |
| Crow | 0.0 /100 | #347 | Tragic 12.1% |