Israeli vs Sierra Leonean Female Unemployment
COMPARE
Israeli
Sierra Leonean
Female Unemployment
Female Unemployment Comparison
Israelis
Sierra Leoneans
5.5%
FEMALE UNEMPLOYMENT
4.8/ 100
METRIC RATING
228th/ 347
METRIC RANK
5.5%
FEMALE UNEMPLOYMENT
3.2/ 100
METRIC RATING
238th/ 347
METRIC RANK
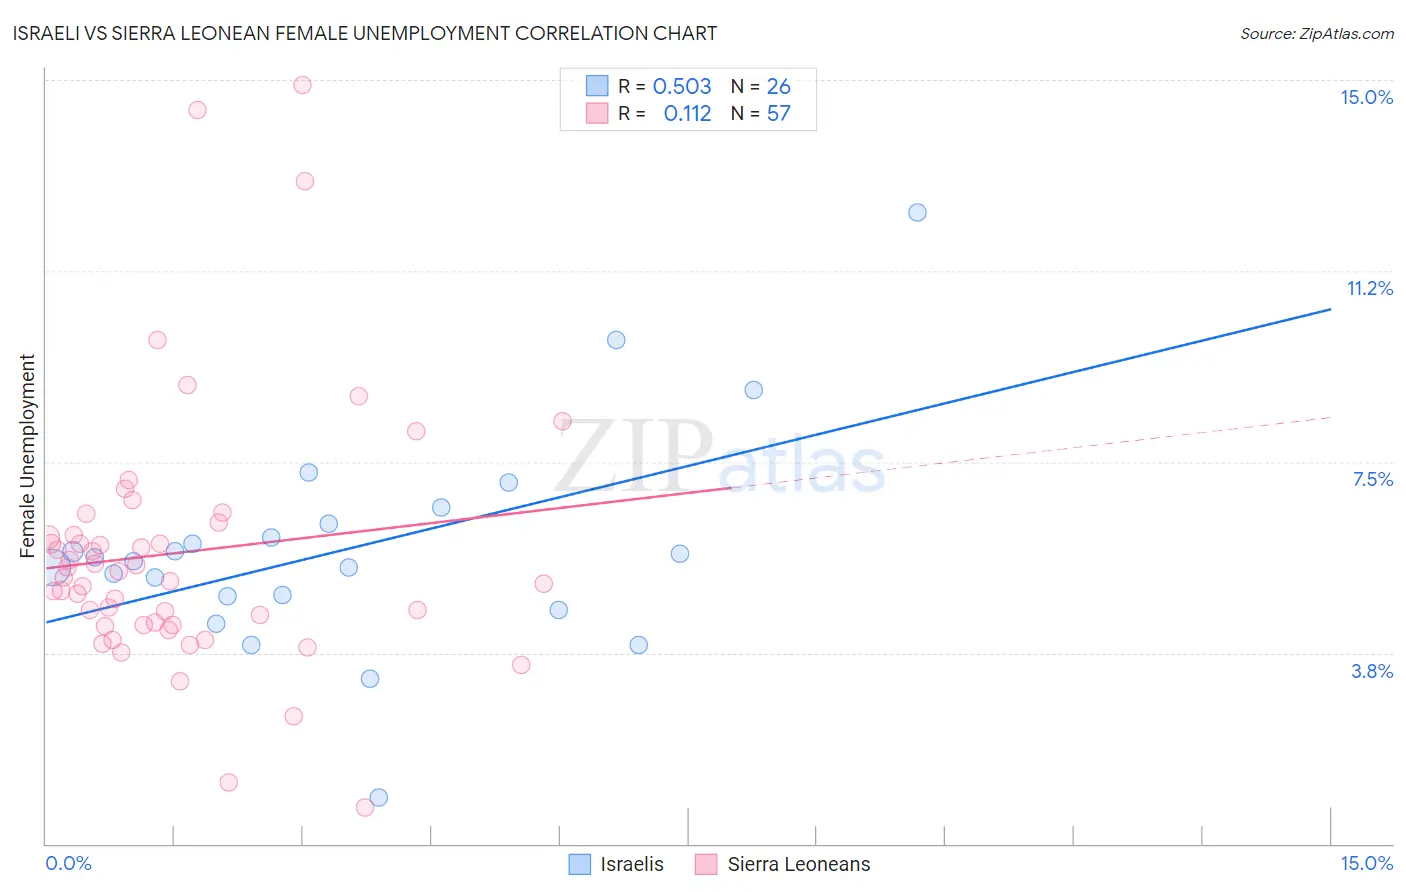
Israeli vs Sierra Leonean Female Unemployment Correlation Chart
The statistical analysis conducted on geographies consisting of 210,819,653 people shows a substantial positive correlation between the proportion of Israelis and unemploymnet rate among females in the United States with a correlation coefficient (R) of 0.503 and weighted average of 5.5%. Similarly, the statistical analysis conducted on geographies consisting of 83,331,757 people shows a poor positive correlation between the proportion of Sierra Leoneans and unemploymnet rate among females in the United States with a correlation coefficient (R) of 0.112 and weighted average of 5.5%, a difference of 0.61%.
Female Unemployment Correlation Summary
| Measurement | Israeli | Sierra Leonean |
| Minimum | 0.90% | 0.70% |
| Maximum | 12.4% | 14.9% |
| Range | 11.5% | 14.2% |
| Mean | 5.8% | 5.7% |
| Median | 5.6% | 5.2% |
| Interquartile 25% (IQ1) | 4.9% | 4.3% |
| Interquartile 75% (IQ3) | 6.3% | 6.2% |
| Interquartile Range (IQR) | 1.4% | 1.9% |
| Standard Deviation (Sample) | 2.2% | 2.6% |
| Standard Deviation (Population) | 2.1% | 2.6% |
Demographics Similar to Israelis and Sierra Leoneans by Female Unemployment
In terms of female unemployment, the demographic groups most similar to Israelis are Panamanian (5.5%, a difference of 0.010%), Immigrants from Uruguay (5.5%, a difference of 0.020%), Immigrants from Philippines (5.5%, a difference of 0.16%), Immigrants from Iraq (5.5%, a difference of 0.30%), and Liberian (5.5%, a difference of 0.30%). Similarly, the demographic groups most similar to Sierra Leoneans are Immigrants from Panama (5.5%, a difference of 0.020%), Immigrants from Cambodia (5.5%, a difference of 0.040%), Immigrants from Lebanon (5.5%, a difference of 0.080%), Immigrants from Iran (5.5%, a difference of 0.080%), and Moroccan (5.5%, a difference of 0.10%).
| Demographics | Rating | Rank | Female Unemployment |
| Delaware | 7.2 /100 | #223 | Tragic 5.5% |
| Iraqis | 7.1 /100 | #224 | Tragic 5.5% |
| French American Indians | 6.1 /100 | #225 | Tragic 5.5% |
| Immigrants | Peru | 5.9 /100 | #226 | Tragic 5.5% |
| Immigrants | Philippines | 5.3 /100 | #227 | Tragic 5.5% |
| Israelis | 4.8 /100 | #228 | Tragic 5.5% |
| Panamanians | 4.7 /100 | #229 | Tragic 5.5% |
| Immigrants | Uruguay | 4.7 /100 | #230 | Tragic 5.5% |
| Immigrants | Iraq | 3.9 /100 | #231 | Tragic 5.5% |
| Liberians | 3.9 /100 | #232 | Tragic 5.5% |
| Moroccans | 3.4 /100 | #233 | Tragic 5.5% |
| Immigrants | Lebanon | 3.3 /100 | #234 | Tragic 5.5% |
| Immigrants | Iran | 3.3 /100 | #235 | Tragic 5.5% |
| Immigrants | Cambodia | 3.3 /100 | #236 | Tragic 5.5% |
| Immigrants | Panama | 3.2 /100 | #237 | Tragic 5.5% |
| Sierra Leoneans | 3.2 /100 | #238 | Tragic 5.5% |
| Aleuts | 3.0 /100 | #239 | Tragic 5.5% |
| Immigrants | South America | 2.9 /100 | #240 | Tragic 5.5% |
| South American Indians | 2.8 /100 | #241 | Tragic 5.5% |
| Marshallese | 2.3 /100 | #242 | Tragic 5.6% |
| Spanish Americans | 2.2 /100 | #243 | Tragic 5.6% |