Israeli vs Immigrants from Afghanistan Female Unemployment
COMPARE
Israeli
Immigrants from Afghanistan
Female Unemployment
Female Unemployment Comparison
Israelis
Immigrants from Afghanistan
5.5%
FEMALE UNEMPLOYMENT
4.8/ 100
METRIC RATING
228th/ 347
METRIC RANK
5.4%
FEMALE UNEMPLOYMENT
18.9/ 100
METRIC RATING
205th/ 347
METRIC RANK
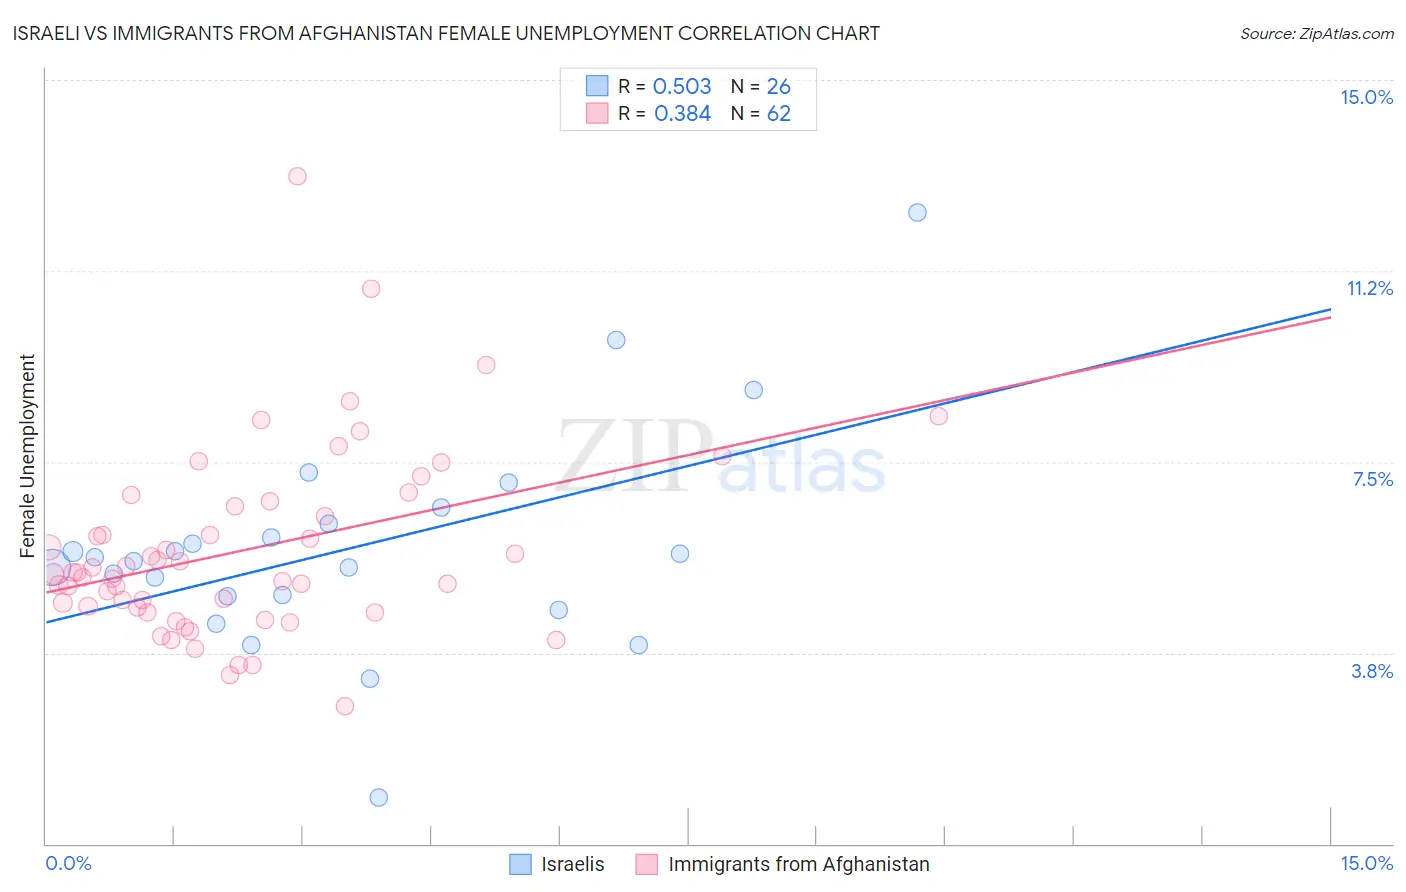
Israeli vs Immigrants from Afghanistan Female Unemployment Correlation Chart
The statistical analysis conducted on geographies consisting of 210,819,653 people shows a substantial positive correlation between the proportion of Israelis and unemploymnet rate among females in the United States with a correlation coefficient (R) of 0.503 and weighted average of 5.5%. Similarly, the statistical analysis conducted on geographies consisting of 147,540,381 people shows a mild positive correlation between the proportion of Immigrants from Afghanistan and unemploymnet rate among females in the United States with a correlation coefficient (R) of 0.384 and weighted average of 5.4%, a difference of 2.3%.
Female Unemployment Correlation Summary
| Measurement | Israeli | Immigrants from Afghanistan |
| Minimum | 0.90% | 2.7% |
| Maximum | 12.4% | 13.1% |
| Range | 11.5% | 10.4% |
| Mean | 5.8% | 5.8% |
| Median | 5.6% | 5.3% |
| Interquartile 25% (IQ1) | 4.9% | 4.6% |
| Interquartile 75% (IQ3) | 6.3% | 6.6% |
| Interquartile Range (IQR) | 1.4% | 2.0% |
| Standard Deviation (Sample) | 2.2% | 1.8% |
| Standard Deviation (Population) | 2.1% | 1.8% |
Similar Demographics by Female Unemployment
Demographics Similar to Israelis by Female Unemployment
In terms of female unemployment, the demographic groups most similar to Israelis are Panamanian (5.5%, a difference of 0.010%), Immigrants from Uruguay (5.5%, a difference of 0.020%), Immigrants from Philippines (5.5%, a difference of 0.16%), Immigrants from Iraq (5.5%, a difference of 0.30%), and Liberian (5.5%, a difference of 0.30%).
| Demographics | Rating | Rank | Female Unemployment |
| Brazilians | 7.3 /100 | #221 | Tragic 5.5% |
| Nicaraguans | 7.2 /100 | #222 | Tragic 5.5% |
| Delaware | 7.2 /100 | #223 | Tragic 5.5% |
| Iraqis | 7.1 /100 | #224 | Tragic 5.5% |
| French American Indians | 6.1 /100 | #225 | Tragic 5.5% |
| Immigrants | Peru | 5.9 /100 | #226 | Tragic 5.5% |
| Immigrants | Philippines | 5.3 /100 | #227 | Tragic 5.5% |
| Israelis | 4.8 /100 | #228 | Tragic 5.5% |
| Panamanians | 4.7 /100 | #229 | Tragic 5.5% |
| Immigrants | Uruguay | 4.7 /100 | #230 | Tragic 5.5% |
| Immigrants | Iraq | 3.9 /100 | #231 | Tragic 5.5% |
| Liberians | 3.9 /100 | #232 | Tragic 5.5% |
| Moroccans | 3.4 /100 | #233 | Tragic 5.5% |
| Immigrants | Lebanon | 3.3 /100 | #234 | Tragic 5.5% |
| Immigrants | Iran | 3.3 /100 | #235 | Tragic 5.5% |
Demographics Similar to Immigrants from Afghanistan by Female Unemployment
In terms of female unemployment, the demographic groups most similar to Immigrants from Afghanistan are Immigrants from Brazil (5.4%, a difference of 0.020%), Immigrants from Israel (5.4%, a difference of 0.070%), Immigrants from South Eastern Asia (5.4%, a difference of 0.13%), Immigrants from Middle Africa (5.4%, a difference of 0.18%), and Iroquois (5.4%, a difference of 0.18%).
| Demographics | Rating | Rank | Female Unemployment |
| Tsimshian | 23.1 /100 | #198 | Fair 5.4% |
| Hawaiians | 22.2 /100 | #199 | Fair 5.4% |
| Soviet Union | 21.7 /100 | #200 | Fair 5.4% |
| Immigrants | Middle Africa | 20.8 /100 | #201 | Fair 5.4% |
| Iroquois | 20.8 /100 | #202 | Fair 5.4% |
| Immigrants | South Eastern Asia | 20.3 /100 | #203 | Fair 5.4% |
| Immigrants | Israel | 19.7 /100 | #204 | Poor 5.4% |
| Immigrants | Afghanistan | 18.9 /100 | #205 | Poor 5.4% |
| Immigrants | Brazil | 18.8 /100 | #206 | Poor 5.4% |
| Creek | 15.4 /100 | #207 | Poor 5.4% |
| Immigrants | Costa Rica | 13.7 /100 | #208 | Poor 5.4% |
| Koreans | 13.4 /100 | #209 | Poor 5.4% |
| Choctaw | 12.3 /100 | #210 | Poor 5.4% |
| Ottawa | 11.6 /100 | #211 | Poor 5.4% |
| Uruguayans | 11.4 /100 | #212 | Poor 5.4% |