Iroquois vs Immigrants from Malaysia Unemployment
COMPARE
Iroquois
Immigrants from Malaysia
Unemployment
Unemployment Comparison
Iroquois
Immigrants from Malaysia
5.4%
UNEMPLOYMENT
10.3/ 100
METRIC RATING
222nd/ 347
METRIC RANK
5.1%
UNEMPLOYMENT
91.0/ 100
METRIC RATING
117th/ 347
METRIC RANK
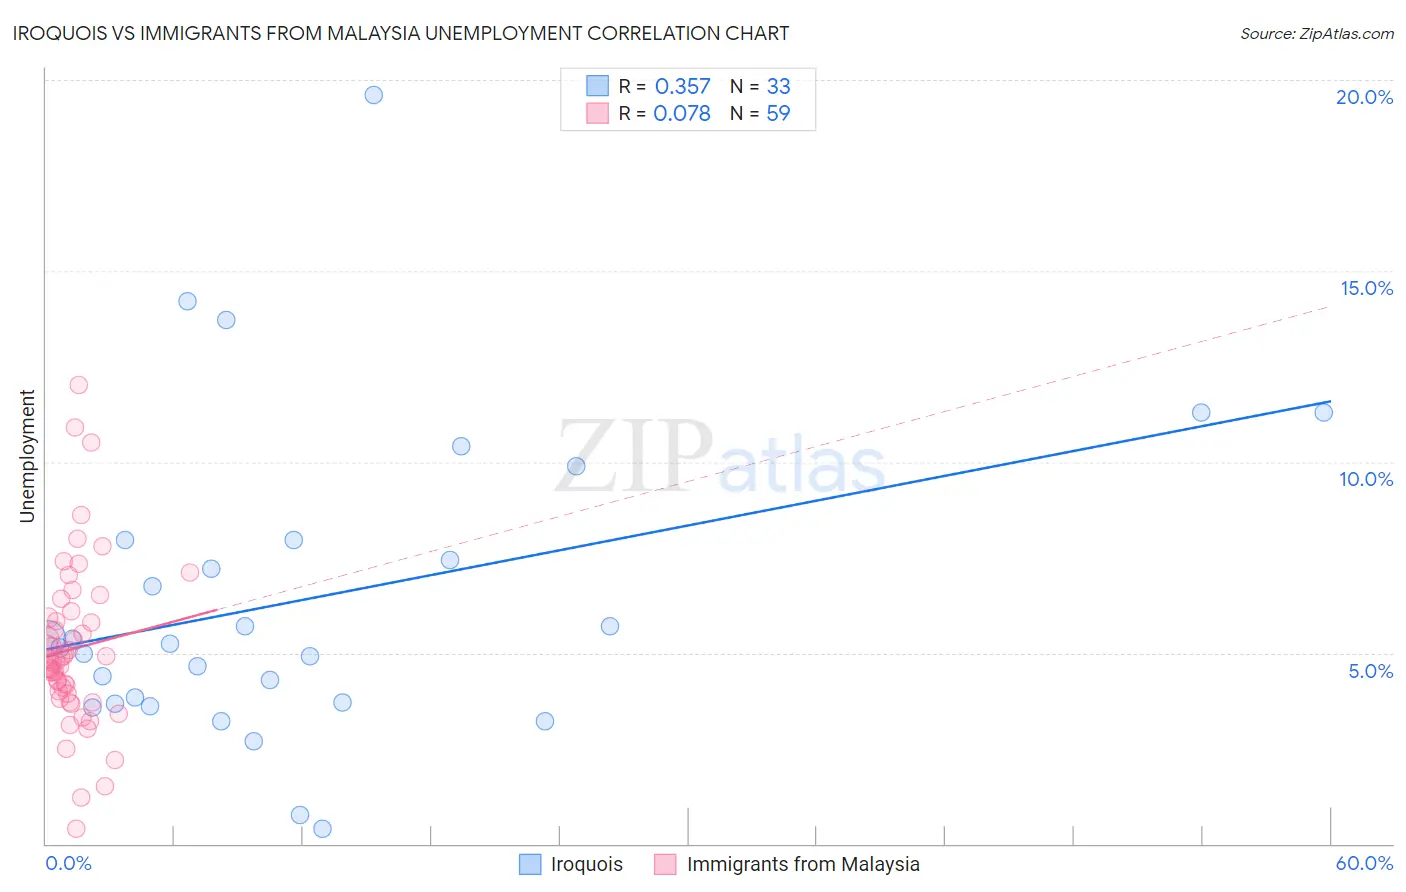
Iroquois vs Immigrants from Malaysia Unemployment Correlation Chart
The statistical analysis conducted on geographies consisting of 207,134,064 people shows a mild positive correlation between the proportion of Iroquois and unemployment in the United States with a correlation coefficient (R) of 0.357 and weighted average of 5.4%. Similarly, the statistical analysis conducted on geographies consisting of 197,947,224 people shows a slight positive correlation between the proportion of Immigrants from Malaysia and unemployment in the United States with a correlation coefficient (R) of 0.078 and weighted average of 5.1%, a difference of 7.1%.
Unemployment Correlation Summary
| Measurement | Iroquois | Immigrants from Malaysia |
| Minimum | 0.40% | 0.41% |
| Maximum | 19.6% | 12.0% |
| Range | 19.2% | 11.6% |
| Mean | 6.4% | 5.1% |
| Median | 5.2% | 4.8% |
| Interquartile 25% (IQ1) | 3.7% | 3.9% |
| Interquartile 75% (IQ3) | 7.9% | 5.9% |
| Interquartile Range (IQR) | 4.3% | 2.0% |
| Standard Deviation (Sample) | 4.1% | 2.1% |
| Standard Deviation (Population) | 4.0% | 2.1% |
Similar Demographics by Unemployment
Demographics Similar to Iroquois by Unemployment
In terms of unemployment, the demographic groups most similar to Iroquois are Immigrants from Philippines (5.4%, a difference of 0.020%), Soviet Union (5.4%, a difference of 0.060%), Bangladeshi (5.4%, a difference of 0.14%), Seminole (5.4%, a difference of 0.18%), and Israeli (5.4%, a difference of 0.25%).
| Demographics | Rating | Rank | Unemployment |
| Delaware | 14.7 /100 | #215 | Poor 5.4% |
| Immigrants | South America | 13.5 /100 | #216 | Poor 5.4% |
| Immigrants | Albania | 13.5 /100 | #217 | Poor 5.4% |
| Choctaw | 12.7 /100 | #218 | Poor 5.4% |
| Bangladeshis | 11.2 /100 | #219 | Poor 5.4% |
| Soviet Union | 10.6 /100 | #220 | Poor 5.4% |
| Immigrants | Philippines | 10.4 /100 | #221 | Poor 5.4% |
| Iroquois | 10.3 /100 | #222 | Poor 5.4% |
| Seminole | 9.2 /100 | #223 | Tragic 5.4% |
| Israelis | 8.8 /100 | #224 | Tragic 5.4% |
| South American Indians | 7.8 /100 | #225 | Tragic 5.5% |
| Samoans | 7.1 /100 | #226 | Tragic 5.5% |
| Immigrants | Lebanon | 7.0 /100 | #227 | Tragic 5.5% |
| Guamanians/Chamorros | 6.3 /100 | #228 | Tragic 5.5% |
| Hawaiians | 5.4 /100 | #229 | Tragic 5.5% |
Demographics Similar to Immigrants from Malaysia by Unemployment
In terms of unemployment, the demographic groups most similar to Immigrants from Malaysia are Immigrants from Sri Lanka (5.1%, a difference of 0.020%), Immigrants from Western Europe (5.1%, a difference of 0.030%), Immigrants from Germany (5.1%, a difference of 0.040%), Immigrants from Ireland (5.1%, a difference of 0.24%), and Immigrants from France (5.1%, a difference of 0.24%).
| Demographics | Rating | Rank | Unemployment |
| Immigrants | Lithuania | 93.2 /100 | #110 | Exceptional 5.0% |
| Chileans | 93.2 /100 | #111 | Exceptional 5.0% |
| South Africans | 92.6 /100 | #112 | Exceptional 5.1% |
| Argentineans | 92.4 /100 | #113 | Exceptional 5.1% |
| Immigrants | Ireland | 92.1 /100 | #114 | Exceptional 5.1% |
| Immigrants | Western Europe | 91.1 /100 | #115 | Exceptional 5.1% |
| Immigrants | Sri Lanka | 91.1 /100 | #116 | Exceptional 5.1% |
| Immigrants | Malaysia | 91.0 /100 | #117 | Exceptional 5.1% |
| Immigrants | Germany | 90.8 /100 | #118 | Exceptional 5.1% |
| Immigrants | France | 89.7 /100 | #119 | Excellent 5.1% |
| Macedonians | 89.7 /100 | #120 | Excellent 5.1% |
| Lebanese | 89.2 /100 | #121 | Excellent 5.1% |
| Immigrants | Switzerland | 89.1 /100 | #122 | Excellent 5.1% |
| Asians | 89.0 /100 | #123 | Excellent 5.1% |
| Ethiopians | 88.6 /100 | #124 | Excellent 5.1% |