Iranian vs Yakama Male Unemployment
COMPARE
Iranian
Yakama
Male Unemployment
Male Unemployment Comparison
Iranians
Yakama
5.0%
MALE UNEMPLOYMENT
96.4/ 100
METRIC RATING
77th/ 347
METRIC RANK
7.9%
MALE UNEMPLOYMENT
0.0/ 100
METRIC RATING
330th/ 347
METRIC RANK
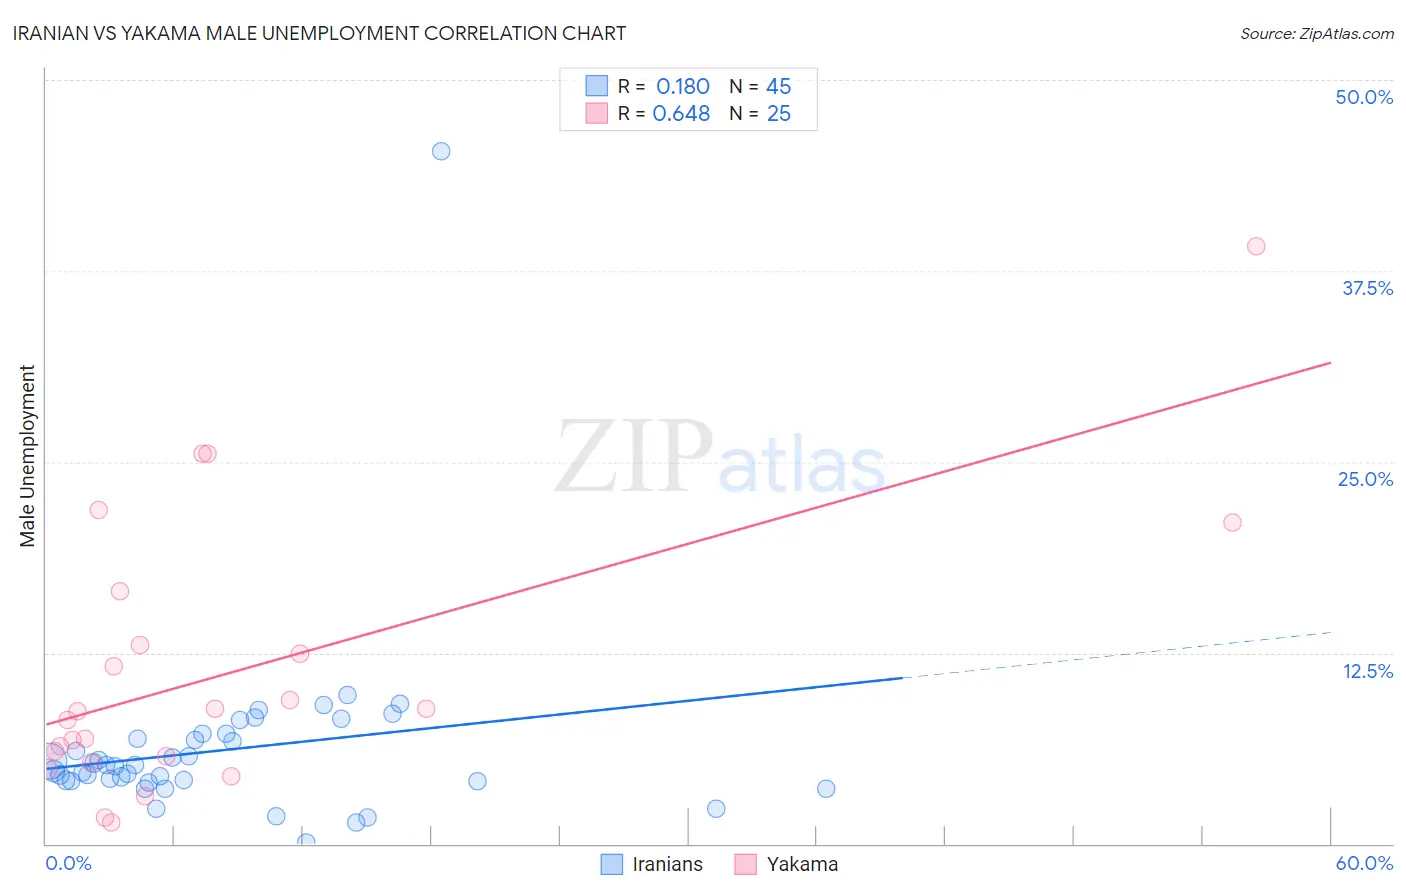
Iranian vs Yakama Male Unemployment Correlation Chart
The statistical analysis conducted on geographies consisting of 316,157,253 people shows a poor positive correlation between the proportion of Iranians and unemployment rate among males in the United States with a correlation coefficient (R) of 0.180 and weighted average of 5.0%. Similarly, the statistical analysis conducted on geographies consisting of 19,892,932 people shows a significant positive correlation between the proportion of Yakama and unemployment rate among males in the United States with a correlation coefficient (R) of 0.648 and weighted average of 7.9%, a difference of 57.3%.
Male Unemployment Correlation Summary
| Measurement | Iranian | Yakama |
| Minimum | 0.10% | 1.4% |
| Maximum | 45.3% | 39.1% |
| Range | 45.2% | 37.7% |
| Mean | 6.1% | 11.3% |
| Median | 5.1% | 8.7% |
| Interquartile 25% (IQ1) | 4.1% | 5.5% |
| Interquartile 75% (IQ3) | 7.0% | 14.7% |
| Interquartile Range (IQR) | 2.9% | 9.2% |
| Standard Deviation (Sample) | 6.4% | 9.0% |
| Standard Deviation (Population) | 6.3% | 8.8% |
Similar Demographics by Male Unemployment
Demographics Similar to Iranians by Male Unemployment
In terms of male unemployment, the demographic groups most similar to Iranians are Immigrants from Northern Europe (5.0%, a difference of 0.010%), South African (5.0%, a difference of 0.020%), Immigrants from Sudan (5.0%, a difference of 0.050%), Argentinean (5.0%, a difference of 0.080%), and French (5.0%, a difference of 0.080%).
| Demographics | Rating | Rank | Male Unemployment |
| Whites/Caucasians | 97.3 /100 | #70 | Exceptional 5.0% |
| New Zealanders | 97.3 /100 | #71 | Exceptional 5.0% |
| Immigrants | South Africa | 97.1 /100 | #72 | Exceptional 5.0% |
| Greeks | 97.0 /100 | #73 | Exceptional 5.0% |
| Immigrants | North America | 96.9 /100 | #74 | Exceptional 5.0% |
| Assyrians/Chaldeans/Syriacs | 96.9 /100 | #75 | Exceptional 5.0% |
| Immigrants | Sudan | 96.5 /100 | #76 | Exceptional 5.0% |
| Iranians | 96.4 /100 | #77 | Exceptional 5.0% |
| Immigrants | Northern Europe | 96.4 /100 | #78 | Exceptional 5.0% |
| South Africans | 96.4 /100 | #79 | Exceptional 5.0% |
| Argentineans | 96.2 /100 | #80 | Exceptional 5.0% |
| French | 96.2 /100 | #81 | Exceptional 5.0% |
| Chileans | 96.2 /100 | #82 | Exceptional 5.0% |
| Immigrants | Eritrea | 96.0 /100 | #83 | Exceptional 5.0% |
| Serbians | 95.7 /100 | #84 | Exceptional 5.1% |
Demographics Similar to Yakama by Male Unemployment
In terms of male unemployment, the demographic groups most similar to Yakama are Immigrants from Yemen (7.8%, a difference of 1.8%), Alaska Native (8.1%, a difference of 1.9%), Native/Alaskan (7.7%, a difference of 2.7%), Paiute (7.7%, a difference of 3.1%), and Immigrants from Dominican Republic (7.6%, a difference of 4.2%).
| Demographics | Rating | Rank | Male Unemployment |
| Immigrants | Grenada | 0.0 /100 | #323 | Tragic 7.6% |
| Dominicans | 0.0 /100 | #324 | Tragic 7.6% |
| Shoshone | 0.0 /100 | #325 | Tragic 7.6% |
| Immigrants | Dominican Republic | 0.0 /100 | #326 | Tragic 7.6% |
| Paiute | 0.0 /100 | #327 | Tragic 7.7% |
| Natives/Alaskans | 0.0 /100 | #328 | Tragic 7.7% |
| Immigrants | Yemen | 0.0 /100 | #329 | Tragic 7.8% |
| Yakama | 0.0 /100 | #330 | Tragic 7.9% |
| Alaska Natives | 0.0 /100 | #331 | Tragic 8.1% |
| Pima | 0.0 /100 | #332 | Tragic 8.3% |
| Sioux | 0.0 /100 | #333 | Tragic 8.4% |
| Tsimshian | 0.0 /100 | #334 | Tragic 8.5% |
| Pueblo | 0.0 /100 | #335 | Tragic 8.5% |
| Yuman | 0.0 /100 | #336 | Tragic 8.6% |
| Puerto Ricans | 0.0 /100 | #337 | Tragic 8.6% |