Indian (Asian) vs Immigrants from Ukraine Unemployment
COMPARE
Indian (Asian)
Immigrants from Ukraine
Unemployment
Unemployment Comparison
Indians (Asian)
Immigrants from Ukraine
5.1%
UNEMPLOYMENT
81.6/ 100
METRIC RATING
147th/ 347
METRIC RANK
5.3%
UNEMPLOYMENT
24.9/ 100
METRIC RATING
204th/ 347
METRIC RANK
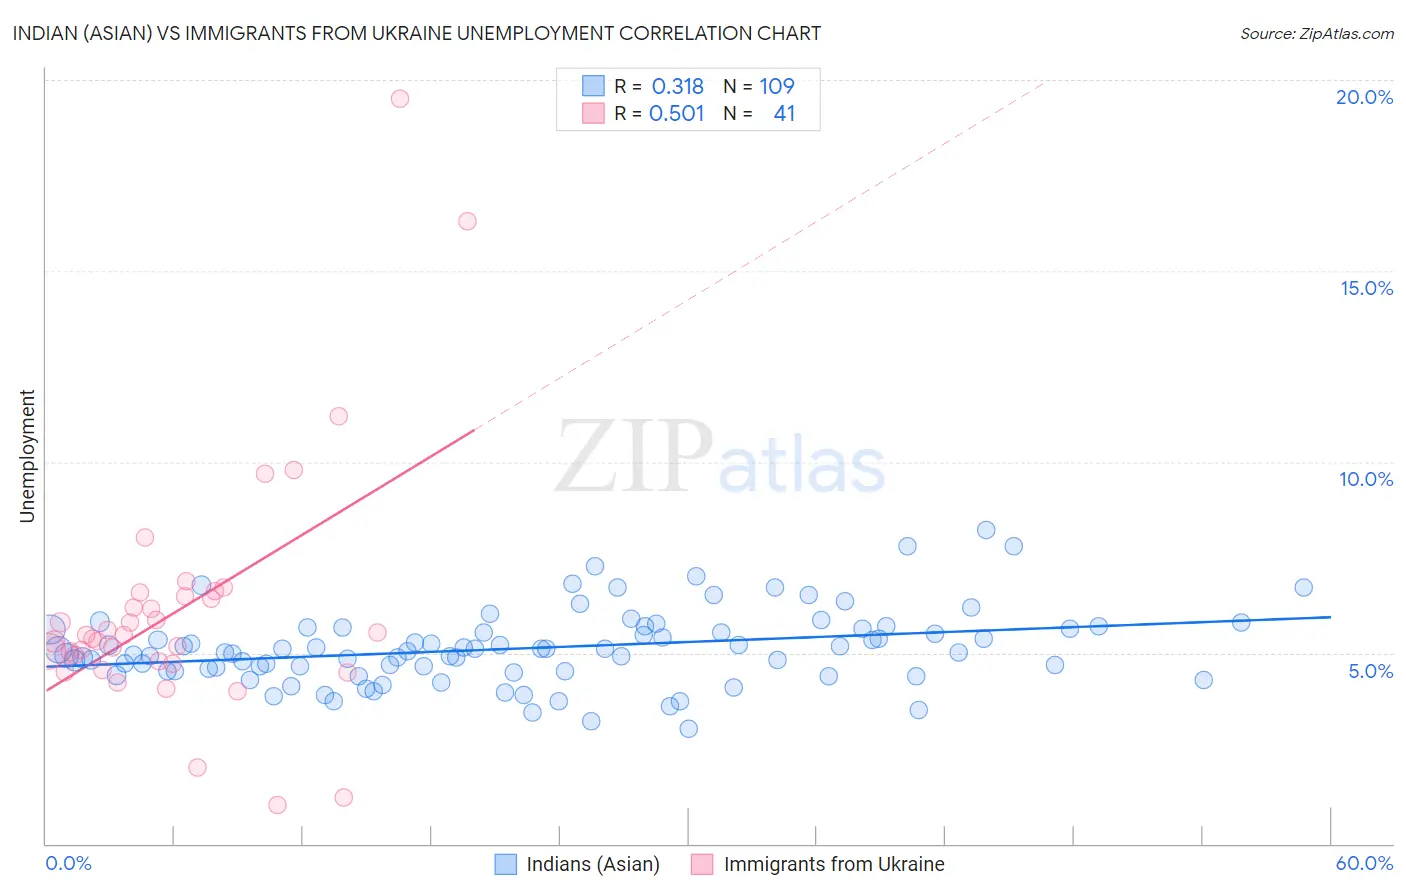
Indian (Asian) vs Immigrants from Ukraine Unemployment Correlation Chart
The statistical analysis conducted on geographies consisting of 494,388,692 people shows a mild positive correlation between the proportion of Indians (Asian) and unemployment in the United States with a correlation coefficient (R) of 0.318 and weighted average of 5.1%. Similarly, the statistical analysis conducted on geographies consisting of 289,507,163 people shows a substantial positive correlation between the proportion of Immigrants from Ukraine and unemployment in the United States with a correlation coefficient (R) of 0.501 and weighted average of 5.3%, a difference of 4.1%.
Unemployment Correlation Summary
| Measurement | Indian (Asian) | Immigrants from Ukraine |
| Minimum | 3.0% | 1.0% |
| Maximum | 8.2% | 19.5% |
| Range | 5.2% | 18.5% |
| Mean | 5.1% | 6.1% |
| Median | 5.0% | 5.5% |
| Interquartile 25% (IQ1) | 4.5% | 4.7% |
| Interquartile 75% (IQ3) | 5.6% | 6.5% |
| Interquartile Range (IQR) | 1.1% | 1.8% |
| Standard Deviation (Sample) | 0.97% | 3.3% |
| Standard Deviation (Population) | 0.96% | 3.3% |
Similar Demographics by Unemployment
Demographics Similar to Indians (Asian) by Unemployment
In terms of unemployment, the demographic groups most similar to Indians (Asian) are Immigrants from Asia (5.1%, a difference of 0.010%), Immigrants from Norway (5.1%, a difference of 0.020%), Indonesian (5.1%, a difference of 0.070%), Immigrants from Chile (5.1%, a difference of 0.12%), and Immigrants from Pakistan (5.1%, a difference of 0.17%).
| Demographics | Rating | Rank | Unemployment |
| Immigrants | Denmark | 84.3 /100 | #140 | Excellent 5.1% |
| Palestinians | 83.4 /100 | #141 | Excellent 5.1% |
| Immigrants | Pakistan | 83.2 /100 | #142 | Excellent 5.1% |
| Immigrants | Chile | 82.8 /100 | #143 | Excellent 5.1% |
| Indonesians | 82.3 /100 | #144 | Excellent 5.1% |
| Immigrants | Norway | 81.8 /100 | #145 | Excellent 5.1% |
| Immigrants | Asia | 81.8 /100 | #146 | Excellent 5.1% |
| Indians (Asian) | 81.6 /100 | #147 | Excellent 5.1% |
| Immigrants | Italy | 79.1 /100 | #148 | Good 5.1% |
| Syrians | 77.7 /100 | #149 | Good 5.2% |
| Potawatomi | 76.2 /100 | #150 | Good 5.2% |
| Immigrants | Eastern Europe | 75.3 /100 | #151 | Good 5.2% |
| Immigrants | Hong Kong | 75.2 /100 | #152 | Good 5.2% |
| Egyptians | 75.2 /100 | #153 | Good 5.2% |
| Immigrants | China | 74.7 /100 | #154 | Good 5.2% |
Demographics Similar to Immigrants from Ukraine by Unemployment
In terms of unemployment, the demographic groups most similar to Immigrants from Ukraine are Immigrants from Micronesia (5.3%, a difference of 0.030%), Cherokee (5.3%, a difference of 0.050%), Native Hawaiian (5.3%, a difference of 0.060%), Immigrants from South Eastern Asia (5.3%, a difference of 0.17%), and Immigrants from Peru (5.4%, a difference of 0.18%).
| Demographics | Rating | Rank | Unemployment |
| Immigrants | Uruguay | 29.8 /100 | #197 | Fair 5.3% |
| Immigrants | Israel | 28.6 /100 | #198 | Fair 5.3% |
| Immigrants | Afghanistan | 28.6 /100 | #199 | Fair 5.3% |
| Koreans | 27.4 /100 | #200 | Fair 5.3% |
| Immigrants | South Eastern Asia | 27.0 /100 | #201 | Fair 5.3% |
| Cherokee | 25.5 /100 | #202 | Fair 5.3% |
| Immigrants | Micronesia | 25.2 /100 | #203 | Fair 5.3% |
| Immigrants | Ukraine | 24.9 /100 | #204 | Fair 5.3% |
| Native Hawaiians | 24.1 /100 | #205 | Fair 5.3% |
| Immigrants | Peru | 22.7 /100 | #206 | Fair 5.4% |
| Creek | 19.4 /100 | #207 | Poor 5.4% |
| Portuguese | 19.0 /100 | #208 | Poor 5.4% |
| Immigrants | Iran | 18.8 /100 | #209 | Poor 5.4% |
| Immigrants | Iraq | 18.6 /100 | #210 | Poor 5.4% |
| Iraqis | 18.1 /100 | #211 | Poor 5.4% |