French Canadian vs Immigrants from Ukraine Unemployment

COMPARE

French Canadian
Race
Ancestry
AfghanAfricanAlaska NativeAlaskan AthabascanAlbanianAleutAlsatianAmericanApacheArabArapahoArgentineanArmenianAssyrian/Chaldean/SyriacAustralianAustrianBahamianBangladeshiBarbadianBasqueBelgianBelizeanBermudanBhutaneseBlackfeetBolivianBrazilianBritishBritish West IndianBulgarianBurmeseCajunCambodianCanadianCape VerdeanCarpatho RusynCelticCentral AmericanCentral American IndianCherokeeCheyenneChickasawChileanChineseChippewaChoctawColombianColvilleComancheCosta RicanCreeCreekCroatianCrowCubanCypriotCzechCzechoslovakianDanishDelawareDominicanDutchDutch West IndianEastern EuropeanEcuadorianEgyptianEnglishEstonianEthiopianEuropeanFijianFilipinoFinnishFrenchFrench American IndianFrench CanadianGermanGerman RussianGhanaianGreekGuamanian/ChamorroGuatemalanGuyaneseHaitianHmongHonduranHopiHoumaHungarianIcelanderIndian (Asian)IndonesianInupiatIranianIraqiIrishIroquoisIsraeliItalianJamaicanJapaneseJordanianKenyanKiowaKoreanLaotianLatvianLebaneseLiberianLithuanianLumbeeLuxembourgerMacedonianMalaysianMalteseMarshalleseMenomineeMexicanMexican American IndianMongolianMoroccanNative HawaiianNavajoNepaleseNew ZealanderNicaraguanNigerianNorthern EuropeanNorwegianOkinawanOsageOttawaPaiutePakistaniPalestinianPanamanianParaguayanPennsylvania GermanPeruvianPimaPolishPortuguesePotawatomiPuebloPuerto RicanPuget Sound SalishRomanianRussianSalvadoranSamoanScandinavianScotch-IrishScottishSeminoleSenegaleseSerbianShoshoneSierra LeoneanSiouxSlavicSlovakSloveneSomaliSouth AfricanSouth AmericanSouth American IndianSoviet UnionSpaniardSpanishSpanish AmericanSpanish American IndianSri LankanSubsaharan AfricanSudaneseSwedishSwissSyrianTaiwaneseThaiTlingit-HaidaTohono O'OdhamTonganTrinidadian and TobagonianTsimshianTurkishU.S. Virgin IslanderUgandanUkrainianUruguayanUteVenezuelanVietnameseWelshWest IndianYakamaYaquiYugoslavianYumanYup'ikZimbabwean
Immigration
NonimmigrantsImmigrantsAfghanistanAfricaAlbaniaArgentinaArmeniaAsiaAustraliaAustriaBahamasBangladeshBarbadosBelarusBelgiumBelizeBoliviaBosnia and HerzegovinaBrazilBulgariaBurma/MyanmarCabo VerdeCambodiaCameroonCanadaCaribbeanCentral AmericaChileChinaColombiaCongoCosta RicaCroatiaCubaCzechoslovakiaDenmarkDominicaDominican RepublicEastern AfricaEastern AsiaEastern EuropeEcuadorEgyptEl SalvadorEnglandEritreaEthiopiaEuropeFijiFranceGermanyGhanaGreeceGrenadaGuatemalaGuyanaHaitiHondurasHong KongHungaryIndiaIndonesiaIranIraqIrelandIsraelItalyJamaicaJapanJordanKazakhstanKenyaKoreaKuwaitLaosLatin AmericaLatviaLebanonLiberiaLithuaniaMalaysiaMexicoMicronesiaMiddle AfricaMoldovaMoroccoNepalNetherlandsNicaraguaNigeriaNorth AmericaNorth MacedoniaNorthern AfricaNorthern EuropeNorwayOceaniaPakistanPanamaPeruPhilippinesPolandPortugalRomaniaRussiaSaudi ArabiaScotlandSenegalSerbiaSierra LeoneSingaporeSomaliaSouth AfricaSouth AmericaSouth Central AsiaSouth Eastern AsiaSouthern EuropeSpainSri LankaSt. Vincent and the GrenadinesSudanSwedenSwitzerlandSyriaTaiwanThailandTrinidad and TobagoTurkeyUgandaUruguayUzbekistanVenezuelaVietnamWest IndiesWestern AfricaWestern AsiaWestern EuropeYemenZaireZimbabweAzores
Immigrants from Ukraine
Race
Ancestry
AfghanAfricanAlaska NativeAlaskan AthabascanAlbanianAleutAlsatianAmericanApacheArabArapahoArgentineanArmenianAssyrian/Chaldean/SyriacAustralianAustrianBahamianBangladeshiBarbadianBasqueBelgianBelizeanBermudanBhutaneseBlackfeetBolivianBrazilianBritishBritish West IndianBulgarianBurmeseCajunCambodianCanadianCape VerdeanCarpatho RusynCelticCentral AmericanCentral American IndianCherokeeCheyenneChickasawChileanChineseChippewaChoctawColombianColvilleComancheCosta RicanCreeCreekCroatianCrowCubanCypriotCzechCzechoslovakianDanishDelawareDominicanDutchDutch West IndianEastern EuropeanEcuadorianEgyptianEnglishEstonianEthiopianEuropeanFijianFilipinoFinnishFrenchFrench American IndianGermanGerman RussianGhanaianGreekGuamanian/ChamorroGuatemalanGuyaneseHaitianHmongHonduranHopiHoumaHungarianIcelanderIndian (Asian)IndonesianInupiatIranianIraqiIrishIroquoisIsraeliItalianJamaicanJapaneseJordanianKenyanKiowaKoreanLaotianLatvianLebaneseLiberianLithuanianLumbeeLuxembourgerMacedonianMalaysianMalteseMarshalleseMenomineeMexicanMexican American IndianMongolianMoroccanNative HawaiianNavajoNepaleseNew ZealanderNicaraguanNigerianNorthern EuropeanNorwegianOkinawanOsageOttawaPaiutePakistaniPalestinianPanamanianParaguayanPennsylvania GermanPeruvianPimaPolishPortuguesePotawatomiPuebloPuerto RicanPuget Sound SalishRomanianRussianSalvadoranSamoanScandinavianScotch-IrishScottishSeminoleSenegaleseSerbianShoshoneSierra LeoneanSiouxSlavicSlovakSloveneSomaliSouth AfricanSouth AmericanSouth American IndianSoviet UnionSpaniardSpanishSpanish AmericanSpanish American IndianSri LankanSubsaharan AfricanSudaneseSwedishSwissSyrianTaiwaneseThaiTlingit-HaidaTohono O'OdhamTonganTrinidadian and TobagonianTsimshianTurkishU.S. Virgin IslanderUgandanUkrainianUruguayanUteVenezuelanVietnameseWelshWest IndianYakamaYaquiYugoslavianYumanYup'ikZimbabwean
Immigration
NonimmigrantsImmigrantsAfghanistanAfricaAlbaniaArgentinaArmeniaAsiaAustraliaAustriaBahamasBangladeshBarbadosBelarusBelgiumBelizeBoliviaBosnia and HerzegovinaBrazilBulgariaBurma/MyanmarCabo VerdeCambodiaCameroonCanadaCaribbeanCentral AmericaChileChinaColombiaCongoCosta RicaCroatiaCubaCzechoslovakiaDenmarkDominicaDominican RepublicEastern AfricaEastern AsiaEastern EuropeEcuadorEgyptEl SalvadorEnglandEritreaEthiopiaEuropeFijiFranceGermanyGhanaGreeceGrenadaGuatemalaGuyanaHaitiHondurasHong KongHungaryIndiaIndonesiaIranIraqIrelandIsraelItalyJamaicaJapanJordanKazakhstanKenyaKoreaKuwaitLaosLatin AmericaLatviaLebanonLiberiaLithuaniaMalaysiaMexicoMicronesiaMiddle AfricaMoldovaMoroccoNepalNetherlandsNicaraguaNigeriaNorth AmericaNorth MacedoniaNorthern AfricaNorthern EuropeNorwayOceaniaPakistanPanamaPeruPhilippinesPolandPortugalRomaniaRussiaSaudi ArabiaScotlandSenegalSerbiaSierra LeoneSingaporeSomaliaSouth AfricaSouth AmericaSouth Central AsiaSouth Eastern AsiaSouthern EuropeSpainSri LankaSt. Vincent and the GrenadinesSudanSwedenSwitzerlandSyriaTaiwanThailandTrinidad and TobagoTurkeyUgandaUkraineUruguayUzbekistanVenezuelaVietnamWest IndiesWestern AfricaWestern AsiaWestern EuropeYemenZaireZimbabweAzores
Unemployment
Income
Poverty
Unemployment
Labor Participation
Family Structure
Vehicle Availability
Education Level
Disability

Unemployment Comparison

French Canadians

Immigrants from Ukraine

Exceptional
Fair
4.9%
UNEMPLOYMENT
99.3/ 100
METRIC RATING
50th/ 347
METRIC RANK
5.3%
UNEMPLOYMENT
24.9/ 100
METRIC RATING
204th/ 347
METRIC RANK

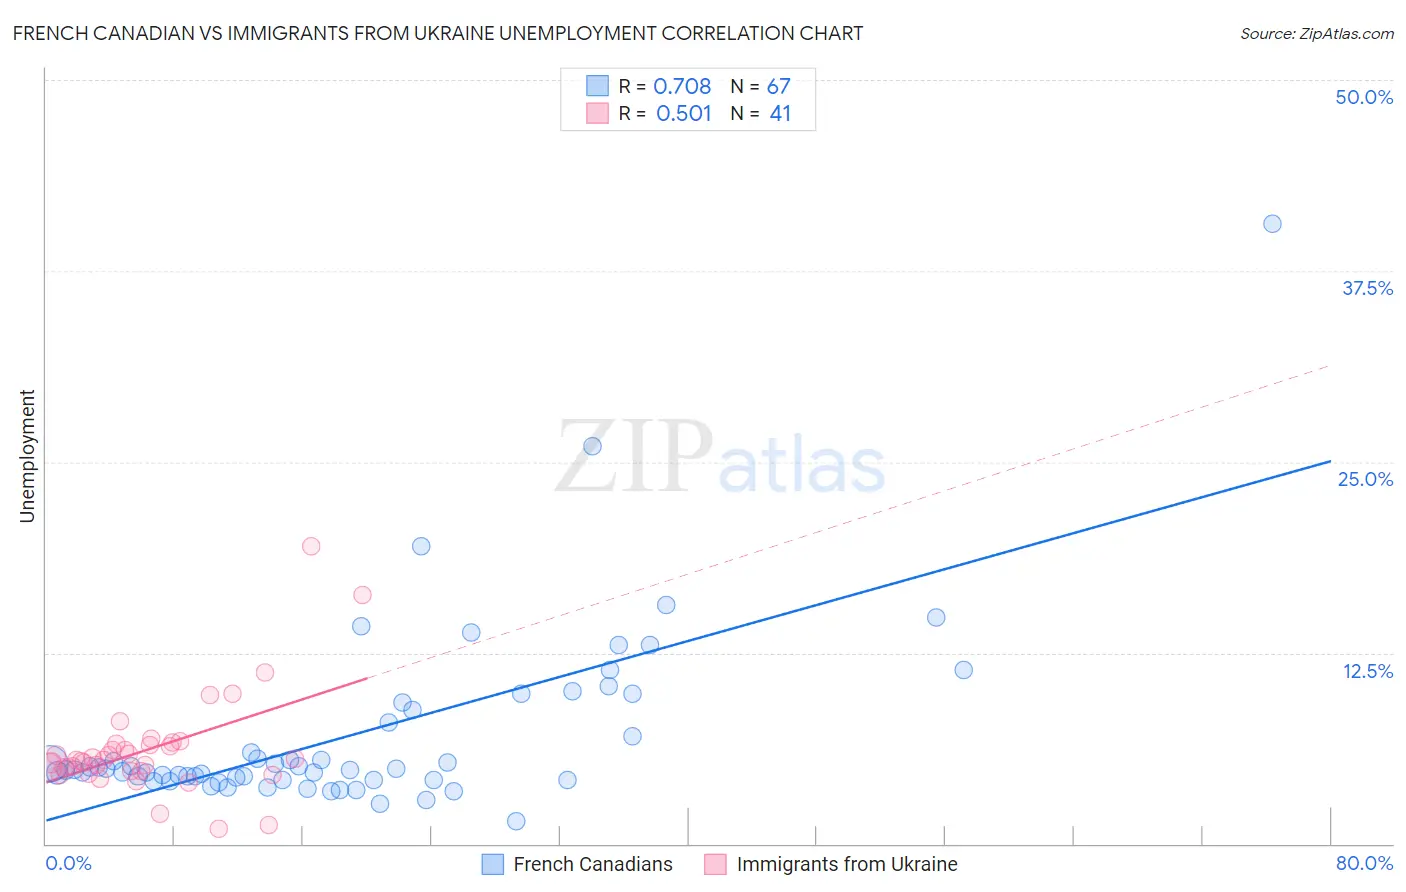
French Canadian vs Immigrants from Ukraine Unemployment Correlation Chart

The statistical analysis conducted on geographies consisting of 500,867,403 people shows a strong positive correlation between the proportion of French Canadians and unemployment in the United States with a correlation coefficient (R) of 0.708 and weighted average of 4.9%. Similarly, the statistical analysis conducted on geographies consisting of 289,507,163 people shows a substantial positive correlation between the proportion of Immigrants from Ukraine and unemployment in the United States with a correlation coefficient (R) of 0.501 and weighted average of 5.3%, a difference of 10.1%.
French Canadian vs Immigrants from Ukraine Unemployment

Unemployment Correlation Summary

MeasurementFrench CanadianImmigrants from Ukraine
Minimum1.5%1.0%
Maximum40.6%19.5%
Range39.1%18.5%
Mean7.1%6.1%
Median4.9%5.5%
Interquartile 25% (IQ1)4.2%4.7%
Interquartile 75% (IQ3)8.7%6.5%
Interquartile Range (IQR)4.5%1.8%
Standard Deviation (Sample)6.0%3.3%
Standard Deviation (Population)6.0%3.3%

Similar Demographics by Unemployment

Demographics Similar to French Canadians by Unemployment

In terms of unemployment, the demographic groups most similar to French Canadians are Immigrants from South Central Asia (4.9%, a difference of 0.020%), Immigrants from Scotland (4.9%, a difference of 0.030%), Immigrants from Belgium (4.9%, a difference of 0.16%), White/Caucasian (4.9%, a difference of 0.17%), and Immigrants from Zimbabwe (4.9%, a difference of 0.20%).
DemographicsRating | RankUnemployment
Yugoslavians
99.5
/100
|
#43
Exceptional
4.8%
Austrians
99.5
/100
|
#44
Exceptional
4.8%
French
99.5
/100
|
#45
Exceptional
4.8%
Immigrants | Nepal
99.4
/100
|
#46
Exceptional
4.8%
Immigrants | Taiwan
99.4
/100
|
#47
Exceptional
4.8%
Immigrants | Scotland
99.3
/100
|
#48
Exceptional
4.9%
Immigrants | South Central Asia
99.3
/100
|
#49
Exceptional
4.9%
French Canadians
99.3
/100
|
#50
Exceptional
4.9%
Immigrants | Belgium
99.2
/100
|
#51
Exceptional
4.9%
Whites/Caucasians
99.2
/100
|
#52
Exceptional
4.9%
Immigrants | Zimbabwe
99.2
/100
|
#53
Exceptional
4.9%
Eastern Europeans
99.2
/100
|
#54
Exceptional
4.9%
Australians
99.2
/100
|
#55
Exceptional
4.9%
Celtics
99.1
/100
|
#56
Exceptional
4.9%
Immigrants | Singapore
99.1
/100
|
#57
Exceptional
4.9%

Demographics Similar to Immigrants from Ukraine by Unemployment

In terms of unemployment, the demographic groups most similar to Immigrants from Ukraine are Immigrants from Micronesia (5.3%, a difference of 0.030%), Cherokee (5.3%, a difference of 0.050%), Native Hawaiian (5.3%, a difference of 0.060%), Immigrants from South Eastern Asia (5.3%, a difference of 0.17%), and Immigrants from Peru (5.4%, a difference of 0.18%).
DemographicsRating | RankUnemployment
Immigrants | Uruguay
29.8
/100
|
#197
Fair
5.3%
Immigrants | Israel
28.6
/100
|
#198
Fair
5.3%
Immigrants | Afghanistan
28.6
/100
|
#199
Fair
5.3%
Koreans
27.4
/100
|
#200
Fair
5.3%
Immigrants | South Eastern Asia
27.0
/100
|
#201
Fair
5.3%
Cherokee
25.5
/100
|
#202
Fair
5.3%
Immigrants | Micronesia
25.2
/100
|
#203
Fair
5.3%
Immigrants | Ukraine
24.9
/100
|
#204
Fair
5.3%
Native Hawaiians
24.1
/100
|
#205
Fair
5.3%
Immigrants | Peru
22.7
/100
|
#206
Fair
5.4%
Creek
19.4
/100
|
#207
Poor
5.4%
Portuguese
19.0
/100
|
#208
Poor
5.4%
Immigrants | Iran
18.8
/100
|
#209
Poor
5.4%
Immigrants | Iraq
18.6
/100
|
#210
Poor
5.4%
Iraqis
18.1
/100
|
#211
Poor
5.4%