Immigrants vs Zimbabwean Unemployment Among Ages 20 to 24 years
COMPARE
Immigrants
Zimbabwean
Unemployment Among Ages 20 to 24 years
Unemployment Among Ages 20 to 24 years Comparison
Immigrants
Zimbabweans
10.6%
UNEMPLOYMENT AMONG AGES 20 TO 24 YEARS
2.7/ 100
METRIC RATING
237th/ 347
METRIC RANK
9.2%
UNEMPLOYMENT AMONG AGES 20 TO 24 YEARS
100.0/ 100
METRIC RATING
11th/ 347
METRIC RANK
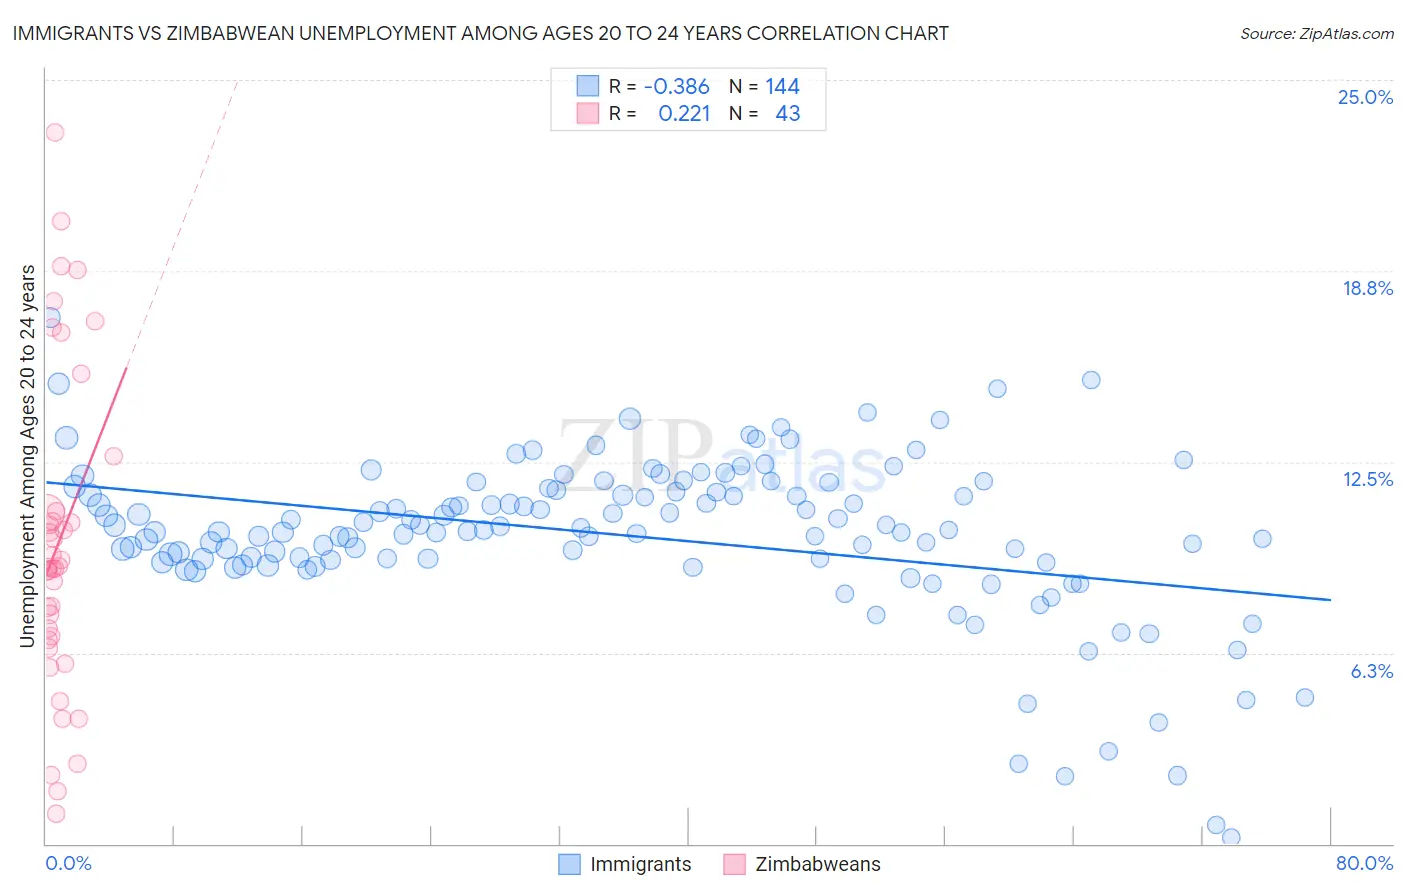
Immigrants vs Zimbabwean Unemployment Among Ages 20 to 24 years Correlation Chart
The statistical analysis conducted on geographies consisting of 528,492,855 people shows a mild negative correlation between the proportion of Immigrants and unemployment rate among population between the ages 20 and 24 in the United States with a correlation coefficient (R) of -0.386 and weighted average of 10.6%. Similarly, the statistical analysis conducted on geographies consisting of 68,995,958 people shows a weak positive correlation between the proportion of Zimbabweans and unemployment rate among population between the ages 20 and 24 in the United States with a correlation coefficient (R) of 0.221 and weighted average of 9.2%, a difference of 15.6%.
Unemployment Among Ages 20 to 24 years Correlation Summary
| Measurement | Immigrants | Zimbabwean |
| Minimum | 0.20% | 1.0% |
| Maximum | 17.2% | 23.3% |
| Range | 17.0% | 22.3% |
| Mean | 10.1% | 9.9% |
| Median | 10.2% | 9.1% |
| Interquartile 25% (IQ1) | 9.3% | 6.7% |
| Interquartile 75% (IQ3) | 11.5% | 10.9% |
| Interquartile Range (IQR) | 2.3% | 4.2% |
| Standard Deviation (Sample) | 2.7% | 5.2% |
| Standard Deviation (Population) | 2.7% | 5.2% |
Similar Demographics by Unemployment Among Ages 20 to 24 years
Demographics Similar to Immigrants by Unemployment Among Ages 20 to 24 years
In terms of unemployment among ages 20 to 24 years, the demographic groups most similar to Immigrants are Immigrants from Pakistan (10.6%, a difference of 0.020%), Salvadoran (10.7%, a difference of 0.080%), Mexican (10.6%, a difference of 0.17%), Immigrants from Ukraine (10.6%, a difference of 0.21%), and Immigrants from Africa (10.6%, a difference of 0.26%).
| Demographics | Rating | Rank | Unemployment Among Ages 20 to 24 years |
| French American Indians | 4.1 /100 | #230 | Tragic 10.6% |
| Native Hawaiians | 3.9 /100 | #231 | Tragic 10.6% |
| Israelis | 3.7 /100 | #232 | Tragic 10.6% |
| Choctaw | 3.6 /100 | #233 | Tragic 10.6% |
| Immigrants | Africa | 3.5 /100 | #234 | Tragic 10.6% |
| Immigrants | Ukraine | 3.3 /100 | #235 | Tragic 10.6% |
| Mexicans | 3.2 /100 | #236 | Tragic 10.6% |
| Immigrants | Immigrants | 2.7 /100 | #237 | Tragic 10.6% |
| Immigrants | Pakistan | 2.6 /100 | #238 | Tragic 10.6% |
| Salvadorans | 2.4 /100 | #239 | Tragic 10.7% |
| Immigrants | Central America | 2.0 /100 | #240 | Tragic 10.7% |
| Immigrants | El Salvador | 1.7 /100 | #241 | Tragic 10.7% |
| Moroccans | 1.4 /100 | #242 | Tragic 10.7% |
| Immigrants | Belarus | 1.3 /100 | #243 | Tragic 10.7% |
| Immigrants | Mexico | 1.2 /100 | #244 | Tragic 10.7% |
Demographics Similar to Zimbabweans by Unemployment Among Ages 20 to 24 years
In terms of unemployment among ages 20 to 24 years, the demographic groups most similar to Zimbabweans are Cuban (9.2%, a difference of 0.10%), Immigrants from Congo (9.2%, a difference of 0.18%), Sudanese (9.2%, a difference of 0.45%), Slovene (9.3%, a difference of 0.57%), and Immigrants from Sudan (9.3%, a difference of 0.60%).
| Demographics | Rating | Rank | Unemployment Among Ages 20 to 24 years |
| Venezuelans | 100.0 /100 | #4 | Exceptional 9.0% |
| Norwegians | 100.0 /100 | #5 | Exceptional 9.0% |
| Immigrants | Burma/Myanmar | 100.0 /100 | #6 | Exceptional 9.1% |
| Luxembourgers | 100.0 /100 | #7 | Exceptional 9.1% |
| Somalis | 100.0 /100 | #8 | Exceptional 9.1% |
| Immigrants | Somalia | 100.0 /100 | #9 | Exceptional 9.2% |
| Sudanese | 100.0 /100 | #10 | Exceptional 9.2% |
| Zimbabweans | 100.0 /100 | #11 | Exceptional 9.2% |
| Cubans | 100.0 /100 | #12 | Exceptional 9.2% |
| Immigrants | Congo | 100.0 /100 | #13 | Exceptional 9.2% |
| Slovenes | 100.0 /100 | #14 | Exceptional 9.3% |
| Immigrants | Sudan | 100.0 /100 | #15 | Exceptional 9.3% |
| Danes | 100.0 /100 | #16 | Exceptional 9.3% |
| Czechs | 100.0 /100 | #17 | Exceptional 9.3% |
| Chinese | 100.0 /100 | #18 | Exceptional 9.4% |