Immigrants from Zimbabwe vs Scotch-Irish Unemployment
COMPARE
Immigrants from Zimbabwe
Scotch-Irish
Unemployment
Unemployment Comparison
Immigrants from Zimbabwe
Scotch-Irish
4.9%
UNEMPLOYMENT
99.2/ 100
METRIC RATING
53rd/ 347
METRIC RANK
4.8%
UNEMPLOYMENT
99.8/ 100
METRIC RATING
35th/ 347
METRIC RANK
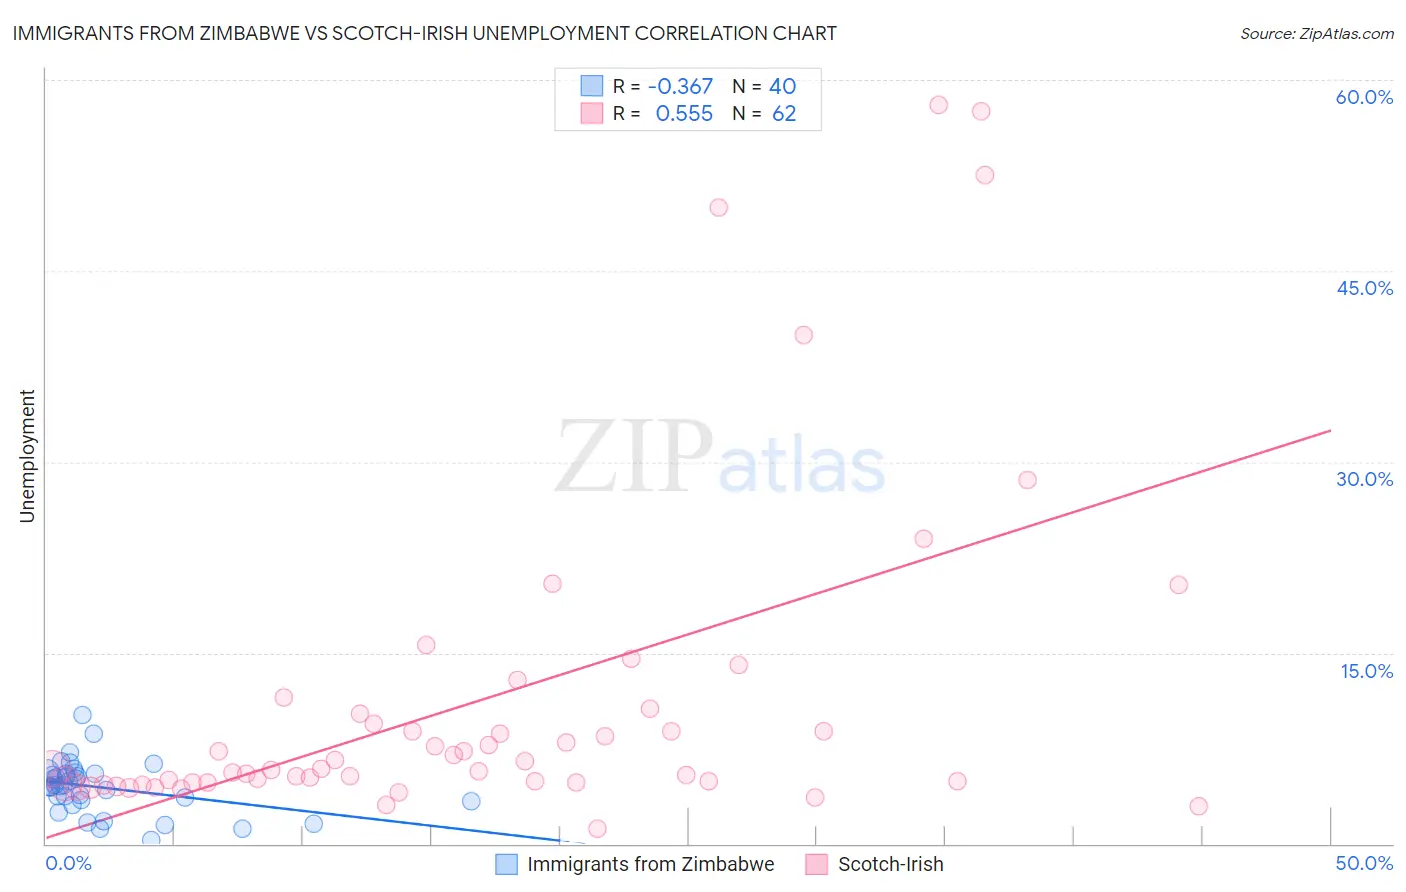
Immigrants from Zimbabwe vs Scotch-Irish Unemployment Correlation Chart
The statistical analysis conducted on geographies consisting of 117,788,083 people shows a mild negative correlation between the proportion of Immigrants from Zimbabwe and unemployment in the United States with a correlation coefficient (R) of -0.367 and weighted average of 4.9%. Similarly, the statistical analysis conducted on geographies consisting of 545,559,279 people shows a substantial positive correlation between the proportion of Scotch-Irish and unemployment in the United States with a correlation coefficient (R) of 0.555 and weighted average of 4.8%, a difference of 2.1%.
Unemployment Correlation Summary
| Measurement | Immigrants from Zimbabwe | Scotch-Irish |
| Minimum | 0.30% | 1.2% |
| Maximum | 10.1% | 58.0% |
| Range | 9.8% | 56.8% |
| Mean | 4.4% | 11.3% |
| Median | 4.6% | 5.9% |
| Interquartile 25% (IQ1) | 3.4% | 4.8% |
| Interquartile 75% (IQ3) | 5.5% | 10.2% |
| Interquartile Range (IQR) | 2.1% | 5.4% |
| Standard Deviation (Sample) | 2.0% | 13.2% |
| Standard Deviation (Population) | 2.0% | 13.1% |
Demographics Similar to Immigrants from Zimbabwe and Scotch-Irish by Unemployment
In terms of unemployment, the demographic groups most similar to Immigrants from Zimbabwe are White/Caucasian (4.9%, a difference of 0.030%), Eastern European (4.9%, a difference of 0.030%), Immigrants from Belgium (4.9%, a difference of 0.040%), French Canadian (4.9%, a difference of 0.20%), and Immigrants from South Central Asia (4.9%, a difference of 0.22%). Similarly, the demographic groups most similar to Scotch-Irish are Immigrants from Bolivia (4.8%, a difference of 0.070%), Tongan (4.8%, a difference of 0.22%), Czechoslovakian (4.8%, a difference of 0.29%), Bolivian (4.8%, a difference of 0.49%), and Lithuanian (4.8%, a difference of 0.63%).
| Demographics | Rating | Rank | Unemployment |
| Immigrants | Bolivia | 99.8 /100 | #34 | Exceptional 4.8% |
| Scotch-Irish | 99.8 /100 | #35 | Exceptional 4.8% |
| Tongans | 99.7 /100 | #36 | Exceptional 4.8% |
| Czechoslovakians | 99.7 /100 | #37 | Exceptional 4.8% |
| Bolivians | 99.7 /100 | #38 | Exceptional 4.8% |
| Lithuanians | 99.7 /100 | #39 | Exceptional 4.8% |
| Northern Europeans | 99.7 /100 | #40 | Exceptional 4.8% |
| Immigrants | Bosnia and Herzegovina | 99.7 /100 | #41 | Exceptional 4.8% |
| Filipinos | 99.5 /100 | #42 | Exceptional 4.8% |
| Yugoslavians | 99.5 /100 | #43 | Exceptional 4.8% |
| Austrians | 99.5 /100 | #44 | Exceptional 4.8% |
| French | 99.5 /100 | #45 | Exceptional 4.8% |
| Immigrants | Nepal | 99.4 /100 | #46 | Exceptional 4.8% |
| Immigrants | Taiwan | 99.4 /100 | #47 | Exceptional 4.8% |
| Immigrants | Scotland | 99.3 /100 | #48 | Exceptional 4.9% |
| Immigrants | South Central Asia | 99.3 /100 | #49 | Exceptional 4.9% |
| French Canadians | 99.3 /100 | #50 | Exceptional 4.9% |
| Immigrants | Belgium | 99.2 /100 | #51 | Exceptional 4.9% |
| Whites/Caucasians | 99.2 /100 | #52 | Exceptional 4.9% |
| Immigrants | Zimbabwe | 99.2 /100 | #53 | Exceptional 4.9% |
| Eastern Europeans | 99.2 /100 | #54 | Exceptional 4.9% |