Immigrants from Zimbabwe vs Laotian Unemployment Among Seniors over 75 years
COMPARE
Immigrants from Zimbabwe
Laotian
Unemployment Among Seniors over 75 years
Unemployment Among Seniors over 75 years Comparison
Immigrants from Zimbabwe
Laotians
9.0%
UNEMPLOYMENT AMONG SENIORS OVER 75 YEARS
7.8/ 100
METRIC RATING
220th/ 347
METRIC RANK
8.2%
UNEMPLOYMENT AMONG SENIORS OVER 75 YEARS
98.8/ 100
METRIC RATING
108th/ 347
METRIC RANK
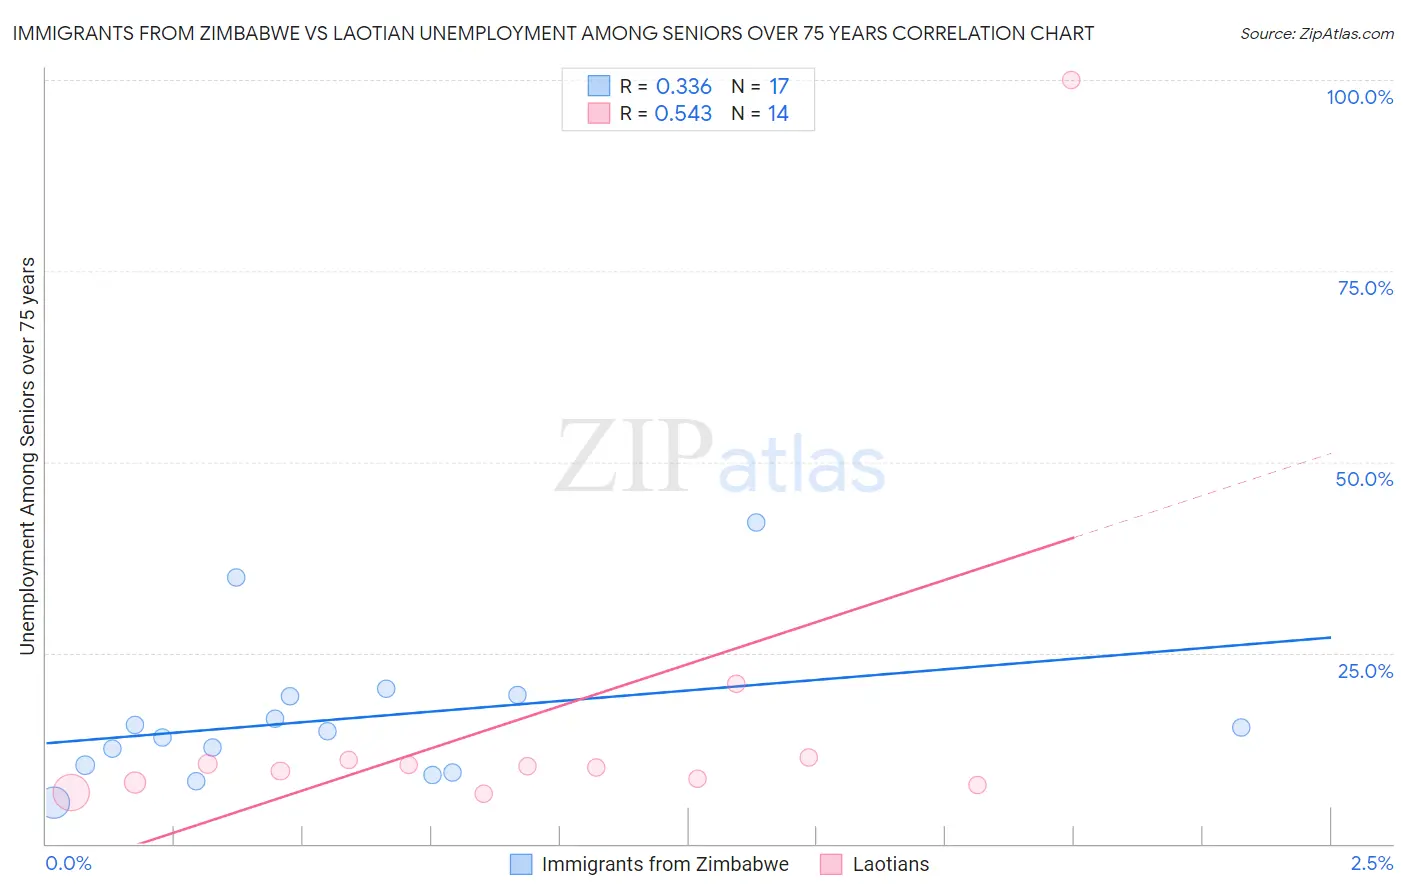
Immigrants from Zimbabwe vs Laotian Unemployment Among Seniors over 75 years Correlation Chart
The statistical analysis conducted on geographies consisting of 87,278,109 people shows a mild positive correlation between the proportion of Immigrants from Zimbabwe and unemployment rate among seniors over the age of 75 in the United States with a correlation coefficient (R) of 0.336 and weighted average of 9.0%. Similarly, the statistical analysis conducted on geographies consisting of 143,496,387 people shows a substantial positive correlation between the proportion of Laotians and unemployment rate among seniors over the age of 75 in the United States with a correlation coefficient (R) of 0.543 and weighted average of 8.2%, a difference of 9.8%.
Unemployment Among Seniors over 75 years Correlation Summary
| Measurement | Immigrants from Zimbabwe | Laotian |
| Minimum | 5.4% | 6.5% |
| Maximum | 42.1% | 100.0% |
| Range | 36.7% | 93.5% |
| Mean | 16.4% | 16.5% |
| Median | 14.7% | 10.1% |
| Interquartile 25% (IQ1) | 9.8% | 8.1% |
| Interquartile 75% (IQ3) | 19.3% | 11.0% |
| Interquartile Range (IQR) | 9.6% | 3.0% |
| Standard Deviation (Sample) | 9.4% | 24.3% |
| Standard Deviation (Population) | 9.1% | 23.4% |
Similar Demographics by Unemployment Among Seniors over 75 years
Demographics Similar to Immigrants from Zimbabwe by Unemployment Among Seniors over 75 years
In terms of unemployment among seniors over 75 years, the demographic groups most similar to Immigrants from Zimbabwe are Guamanian/Chamorro (9.0%, a difference of 0.020%), Afghan (9.0%, a difference of 0.080%), Peruvian (9.0%, a difference of 0.10%), Immigrants from Jordan (9.0%, a difference of 0.16%), and Costa Rican (9.1%, a difference of 0.30%).
| Demographics | Rating | Rank | Unemployment Among Seniors over 75 years |
| Immigrants | Latin America | 13.4 /100 | #213 | Poor 9.0% |
| Immigrants | Brazil | 13.3 /100 | #214 | Poor 9.0% |
| Immigrants | Western Asia | 12.5 /100 | #215 | Poor 9.0% |
| Immigrants | Oceania | 11.8 /100 | #216 | Poor 9.0% |
| Lebanese | 11.1 /100 | #217 | Poor 9.0% |
| Immigrants | Africa | 9.7 /100 | #218 | Tragic 9.0% |
| Afghans | 8.3 /100 | #219 | Tragic 9.0% |
| Immigrants | Zimbabwe | 7.8 /100 | #220 | Tragic 9.0% |
| Guamanians/Chamorros | 7.7 /100 | #221 | Tragic 9.0% |
| Peruvians | 7.3 /100 | #222 | Tragic 9.0% |
| Immigrants | Jordan | 6.9 /100 | #223 | Tragic 9.0% |
| Costa Ricans | 6.3 /100 | #224 | Tragic 9.1% |
| Navajo | 6.1 /100 | #225 | Tragic 9.1% |
| Immigrants | Bangladesh | 5.9 /100 | #226 | Tragic 9.1% |
| Samoans | 5.7 /100 | #227 | Tragic 9.1% |
Demographics Similar to Laotians by Unemployment Among Seniors over 75 years
In terms of unemployment among seniors over 75 years, the demographic groups most similar to Laotians are Immigrants from Lebanon (8.2%, a difference of 0.020%), Marshallese (8.2%, a difference of 0.050%), French American Indian (8.2%, a difference of 0.10%), Sri Lankan (8.2%, a difference of 0.13%), and Immigrants from India (8.2%, a difference of 0.22%).
| Demographics | Rating | Rank | Unemployment Among Seniors over 75 years |
| Immigrants | Serbia | 99.2 /100 | #101 | Exceptional 8.2% |
| Immigrants | Panama | 99.1 /100 | #102 | Exceptional 8.2% |
| South American Indians | 99.1 /100 | #103 | Exceptional 8.2% |
| Immigrants | South Central Asia | 99.0 /100 | #104 | Exceptional 8.2% |
| Immigrants | Caribbean | 99.0 /100 | #105 | Exceptional 8.2% |
| Immigrants | Honduras | 99.0 /100 | #106 | Exceptional 8.2% |
| Sri Lankans | 98.9 /100 | #107 | Exceptional 8.2% |
| Laotians | 98.8 /100 | #108 | Exceptional 8.2% |
| Immigrants | Lebanon | 98.8 /100 | #109 | Exceptional 8.2% |
| Marshallese | 98.7 /100 | #110 | Exceptional 8.2% |
| French American Indians | 98.7 /100 | #111 | Exceptional 8.2% |
| Immigrants | India | 98.6 /100 | #112 | Exceptional 8.2% |
| Asians | 98.5 /100 | #113 | Exceptional 8.3% |
| Trinidadians and Tobagonians | 98.4 /100 | #114 | Exceptional 8.3% |
| Sudanese | 98.2 /100 | #115 | Exceptional 8.3% |