Immigrants from Zaire vs Immigrants from Nepal Male Unemployment

COMPARE

Immigrants from Zaire
Race
Ancestry
AfghanAfricanAlaska NativeAlaskan AthabascanAlbanianAleutAlsatianAmericanApacheArabArapahoArgentineanArmenianAssyrian/Chaldean/SyriacAustralianAustrianBahamianBangladeshiBarbadianBasqueBelgianBelizeanBermudanBhutaneseBlackfeetBolivianBrazilianBritishBritish West IndianBulgarianBurmeseCajunCambodianCanadianCape VerdeanCarpatho RusynCelticCentral AmericanCentral American IndianCherokeeCheyenneChickasawChileanChineseChippewaChoctawColombianColvilleComancheCosta RicanCreeCreekCroatianCrowCubanCypriotCzechCzechoslovakianDanishDelawareDominicanDutchDutch West IndianEastern EuropeanEcuadorianEgyptianEnglishEstonianEthiopianEuropeanFijianFilipinoFinnishFrenchFrench American IndianFrench CanadianGermanGerman RussianGhanaianGreekGuamanian/ChamorroGuatemalanGuyaneseHaitianHmongHonduranHopiHoumaHungarianIcelanderIndian (Asian)IndonesianInupiatIranianIraqiIrishIroquoisIsraeliItalianJamaicanJapaneseJordanianKenyanKiowaKoreanLaotianLatvianLebaneseLiberianLithuanianLumbeeLuxembourgerMacedonianMalaysianMalteseMarshalleseMenomineeMexicanMexican American IndianMongolianMoroccanNative HawaiianNavajoNepaleseNew ZealanderNicaraguanNigerianNorthern EuropeanNorwegianOkinawanOsageOttawaPaiutePakistaniPalestinianPanamanianParaguayanPennsylvania GermanPeruvianPimaPolishPortuguesePotawatomiPuebloPuerto RicanPuget Sound SalishRomanianRussianSalvadoranSamoanScandinavianScotch-IrishScottishSeminoleSenegaleseSerbianShoshoneSierra LeoneanSiouxSlavicSlovakSloveneSomaliSouth AfricanSouth AmericanSouth American IndianSoviet UnionSpaniardSpanishSpanish AmericanSpanish American IndianSri LankanSubsaharan AfricanSudaneseSwedishSwissSyrianTaiwaneseThaiTlingit-HaidaTohono O'OdhamTonganTrinidadian and TobagonianTsimshianTurkishU.S. Virgin IslanderUgandanUkrainianUruguayanUteVenezuelanVietnameseWelshWest IndianYakamaYaquiYugoslavianYumanYup'ikZimbabwean
Immigration
NonimmigrantsImmigrantsAfghanistanAfricaAlbaniaArgentinaArmeniaAsiaAustraliaAustriaBahamasBangladeshBarbadosBelarusBelgiumBelizeBoliviaBosnia and HerzegovinaBrazilBulgariaBurma/MyanmarCabo VerdeCambodiaCameroonCanadaCaribbeanCentral AmericaChileChinaColombiaCongoCosta RicaCroatiaCubaCzechoslovakiaDenmarkDominicaDominican RepublicEastern AfricaEastern AsiaEastern EuropeEcuadorEgyptEl SalvadorEnglandEritreaEthiopiaEuropeFijiFranceGermanyGhanaGreeceGrenadaGuatemalaGuyanaHaitiHondurasHong KongHungaryIndiaIndonesiaIranIraqIrelandIsraelItalyJamaicaJapanJordanKazakhstanKenyaKoreaKuwaitLaosLatin AmericaLatviaLebanonLiberiaLithuaniaMalaysiaMexicoMicronesiaMiddle AfricaMoldovaMoroccoNetherlandsNicaraguaNigeriaNorth AmericaNorth MacedoniaNorthern AfricaNorthern EuropeNorwayOceaniaPakistanPanamaPeruPhilippinesPolandPortugalRomaniaRussiaSaudi ArabiaScotlandSenegalSerbiaSierra LeoneSingaporeSomaliaSouth AfricaSouth AmericaSouth Central AsiaSouth Eastern AsiaSouthern EuropeSpainSri LankaSt. Vincent and the GrenadinesSudanSwedenSwitzerlandSyriaTaiwanThailandTrinidad and TobagoTurkeyUgandaUkraineUruguayUzbekistanVenezuelaVietnamWest IndiesWestern AfricaWestern AsiaWestern EuropeYemenZaireZimbabweAzores
Immigrants from Nepal
Race
Ancestry
AfghanAfricanAlaska NativeAlaskan AthabascanAlbanianAleutAlsatianAmericanApacheArabArapahoArgentineanArmenianAssyrian/Chaldean/SyriacAustralianAustrianBahamianBangladeshiBarbadianBasqueBelgianBelizeanBermudanBhutaneseBlackfeetBolivianBrazilianBritishBritish West IndianBulgarianBurmeseCajunCambodianCanadianCape VerdeanCarpatho RusynCelticCentral AmericanCentral American IndianCherokeeCheyenneChickasawChileanChineseChippewaChoctawColombianColvilleComancheCosta RicanCreeCreekCroatianCrowCubanCypriotCzechCzechoslovakianDanishDelawareDominicanDutchDutch West IndianEastern EuropeanEcuadorianEgyptianEnglishEstonianEthiopianEuropeanFijianFilipinoFinnishFrenchFrench American IndianFrench CanadianGermanGerman RussianGhanaianGreekGuamanian/ChamorroGuatemalanGuyaneseHaitianHmongHonduranHopiHoumaHungarianIcelanderIndian (Asian)IndonesianInupiatIranianIraqiIrishIroquoisIsraeliItalianJamaicanJapaneseJordanianKenyanKiowaKoreanLaotianLatvianLebaneseLiberianLithuanianLumbeeLuxembourgerMacedonianMalaysianMalteseMarshalleseMenomineeMexicanMexican American IndianMongolianMoroccanNative HawaiianNavajoNepaleseNew ZealanderNicaraguanNigerianNorthern EuropeanNorwegianOkinawanOsageOttawaPaiutePakistaniPalestinianPanamanianParaguayanPennsylvania GermanPeruvianPimaPolishPortuguesePotawatomiPuebloPuerto RicanPuget Sound SalishRomanianRussianSalvadoranSamoanScandinavianScotch-IrishScottishSeminoleSenegaleseSerbianShoshoneSierra LeoneanSiouxSlavicSlovakSloveneSomaliSouth AfricanSouth AmericanSouth American IndianSoviet UnionSpaniardSpanishSpanish AmericanSpanish American IndianSri LankanSubsaharan AfricanSudaneseSwedishSwissSyrianTaiwaneseThaiTlingit-HaidaTohono O'OdhamTonganTrinidadian and TobagonianTsimshianTurkishU.S. Virgin IslanderUgandanUkrainianUruguayanUteVenezuelanVietnameseWelshWest IndianYakamaYaquiYugoslavianYumanYup'ikZimbabwean
Immigration
NonimmigrantsImmigrantsAfghanistanAfricaAlbaniaArgentinaArmeniaAsiaAustraliaAustriaBahamasBangladeshBarbadosBelarusBelgiumBelizeBoliviaBosnia and HerzegovinaBrazilBulgariaBurma/MyanmarCabo VerdeCambodiaCameroonCanadaCaribbeanCentral AmericaChileChinaColombiaCongoCosta RicaCroatiaCubaCzechoslovakiaDenmarkDominicaDominican RepublicEastern AfricaEastern AsiaEastern EuropeEcuadorEgyptEl SalvadorEnglandEritreaEthiopiaEuropeFijiFranceGermanyGhanaGreeceGrenadaGuatemalaGuyanaHaitiHondurasHong KongHungaryIndiaIndonesiaIranIraqIrelandIsraelItalyJamaicaJapanJordanKazakhstanKenyaKoreaKuwaitLaosLatin AmericaLatviaLebanonLiberiaLithuaniaMalaysiaMexicoMicronesiaMiddle AfricaMoldovaMoroccoNepalNetherlandsNicaraguaNigeriaNorth AmericaNorth MacedoniaNorthern AfricaNorthern EuropeNorwayOceaniaPakistanPanamaPeruPhilippinesPolandPortugalRomaniaRussiaSaudi ArabiaScotlandSenegalSerbiaSierra LeoneSingaporeSomaliaSouth AfricaSouth AmericaSouth Central AsiaSouth Eastern AsiaSouthern EuropeSpainSri LankaSt. Vincent and the GrenadinesSudanSwedenSwitzerlandSyriaTaiwanThailandTrinidad and TobagoTurkeyUgandaUkraineUruguayUzbekistanVenezuelaVietnamWest IndiesWestern AfricaWestern AsiaWestern EuropeYemenZimbabweAzores
Male Unemployment
Income
Poverty
Unemployment
Labor Participation
Family Structure
Vehicle Availability
Education Level
Disability

Male Unemployment Comparison

Immigrants from Zaire

Immigrants from Nepal

Poor
Exceptional
5.4%
MALE UNEMPLOYMENT
13.7/ 100
METRIC RATING
200th/ 347
METRIC RANK
4.8%
MALE UNEMPLOYMENT
99.8/ 100
METRIC RATING
32nd/ 347
METRIC RANK

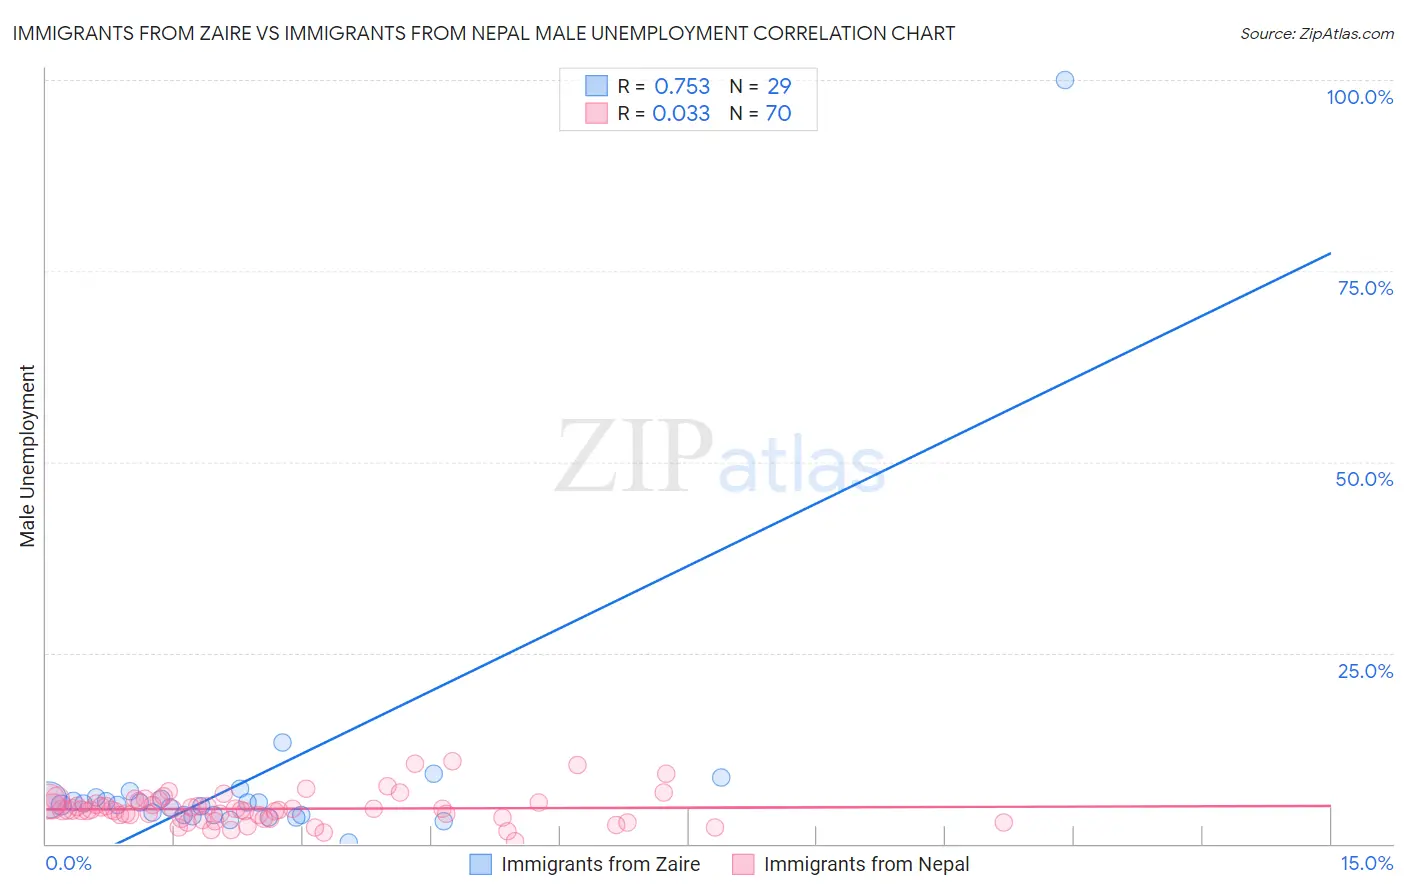
Immigrants from Zaire vs Immigrants from Nepal Male Unemployment Correlation Chart

The statistical analysis conducted on geographies consisting of 107,173,070 people shows a strong positive correlation between the proportion of Immigrants from Zaire and unemployment rate among males in the United States with a correlation coefficient (R) of 0.753 and weighted average of 5.4%. Similarly, the statistical analysis conducted on geographies consisting of 186,501,953 people shows no correlation between the proportion of Immigrants from Nepal and unemployment rate among males in the United States with a correlation coefficient (R) of 0.033 and weighted average of 4.8%, a difference of 12.6%.
Immigrants from Zaire vs Immigrants from Nepal Male Unemployment

Male Unemployment Correlation Summary

MeasurementImmigrants from ZaireImmigrants from Nepal
Minimum0.20%0.30%
Maximum100.0%10.8%
Range99.8%10.5%
Mean8.5%4.6%
Median5.3%4.5%
Interquartile 25% (IQ1)3.7%3.4%
Interquartile 75% (IQ3)6.0%5.4%
Interquartile Range (IQR)2.3%2.0%
Standard Deviation (Sample)17.7%2.0%
Standard Deviation (Population)17.4%2.0%

Similar Demographics by Male Unemployment

Demographics Similar to Immigrants from Zaire by Male Unemployment

In terms of male unemployment, the demographic groups most similar to Immigrants from Zaire are Immigrants from Philippines (5.4%, a difference of 0.020%), Nonimmigrants (5.4%, a difference of 0.070%), Immigrants from Laos (5.4%, a difference of 0.080%), Immigrants from Greece (5.4%, a difference of 0.10%), and Immigrants from Thailand (5.4%, a difference of 0.12%).
DemographicsRating | RankMale Unemployment
Immigrants | Israel
25.2
/100
|
#193
Fair
5.4%
Spanish
19.7
/100
|
#194
Poor
5.4%
Immigrants | Southern Europe
17.7
/100
|
#195
Poor
5.4%
Albanians
17.3
/100
|
#196
Poor
5.4%
Alsatians
16.7
/100
|
#197
Poor
5.4%
Immigrants | Thailand
14.7
/100
|
#198
Poor
5.4%
Immigrants | Greece
14.5
/100
|
#199
Poor
5.4%
Immigrants | Zaire
13.7
/100
|
#200
Poor
5.4%
Immigrants | Philippines
13.5
/100
|
#201
Poor
5.4%
Immigrants | Nonimmigrants
13.1
/100
|
#202
Poor
5.4%
Immigrants | Laos
13.0
/100
|
#203
Poor
5.4%
Guamanians/Chamorros
12.3
/100
|
#204
Poor
5.4%
Immigrants | Costa Rica
11.4
/100
|
#205
Poor
5.5%
Immigrants | Ukraine
9.9
/100
|
#206
Tragic
5.5%
Immigrants | Syria
9.3
/100
|
#207
Tragic
5.5%

Demographics Similar to Immigrants from Nepal by Male Unemployment

In terms of male unemployment, the demographic groups most similar to Immigrants from Nepal are Sudanese (4.8%, a difference of 0.010%), British (4.8%, a difference of 0.26%), Latvian (4.8%, a difference of 0.30%), Welsh (4.8%, a difference of 0.38%), and Scottish (4.8%, a difference of 0.57%).
DemographicsRating | RankMale Unemployment
Zimbabweans
99.9
/100
|
#25
Exceptional
4.8%
Dutch
99.9
/100
|
#26
Exceptional
4.8%
Belgians
99.9
/100
|
#27
Exceptional
4.8%
Bulgarians
99.8
/100
|
#28
Exceptional
4.8%
Scottish
99.8
/100
|
#29
Exceptional
4.8%
British
99.8
/100
|
#30
Exceptional
4.8%
Sudanese
99.8
/100
|
#31
Exceptional
4.8%
Immigrants | Nepal
99.8
/100
|
#32
Exceptional
4.8%
Latvians
99.7
/100
|
#33
Exceptional
4.8%
Welsh
99.7
/100
|
#34
Exceptional
4.8%
Paraguayans
99.5
/100
|
#35
Exceptional
4.9%
Immigrants | Singapore
99.4
/100
|
#36
Exceptional
4.9%
Scotch-Irish
99.4
/100
|
#37
Exceptional
4.9%
Immigrants | Bosnia and Herzegovina
99.4
/100
|
#38
Exceptional
4.9%
Burmese
99.3
/100
|
#39
Exceptional
4.9%