Immigrants from Western Africa vs Ute Unemployment Among Women with Children Under 18 years

COMPARE

Immigrants from Western Africa
Race
Ancestry
AfghanAfricanAlaska NativeAlaskan AthabascanAlbanianAleutAlsatianAmericanApacheArabArapahoArgentineanArmenianAssyrian/Chaldean/SyriacAustralianAustrianBahamianBangladeshiBarbadianBasqueBelgianBelizeanBermudanBhutaneseBlackfeetBolivianBrazilianBritishBritish West IndianBulgarianBurmeseCajunCambodianCanadianCape VerdeanCarpatho RusynCelticCentral AmericanCentral American IndianCherokeeCheyenneChickasawChileanChineseChippewaChoctawColombianColvilleComancheCosta RicanCreeCreekCroatianCrowCubanCypriotCzechCzechoslovakianDanishDelawareDominicanDutchDutch West IndianEastern EuropeanEcuadorianEgyptianEnglishEstonianEthiopianEuropeanFijianFilipinoFinnishFrenchFrench American IndianFrench CanadianGermanGerman RussianGhanaianGreekGuamanian/ChamorroGuatemalanGuyaneseHaitianHmongHonduranHopiHoumaHungarianIcelanderIndian (Asian)IndonesianInupiatIranianIraqiIrishIroquoisIsraeliItalianJamaicanJapaneseJordanianKenyanKiowaKoreanLaotianLatvianLebaneseLiberianLithuanianLumbeeLuxembourgerMacedonianMalaysianMalteseMarshalleseMenomineeMexicanMexican American IndianMongolianMoroccanNative HawaiianNavajoNepaleseNew ZealanderNicaraguanNigerianNorthern EuropeanNorwegianOkinawanOsageOttawaPaiutePakistaniPalestinianPanamanianParaguayanPennsylvania GermanPeruvianPimaPolishPortuguesePotawatomiPuebloPuerto RicanPuget Sound SalishRomanianRussianSalvadoranSamoanScandinavianScotch-IrishScottishSeminoleSenegaleseSerbianShoshoneSierra LeoneanSiouxSlavicSlovakSloveneSomaliSouth AfricanSouth AmericanSouth American IndianSoviet UnionSpaniardSpanishSpanish AmericanSpanish American IndianSri LankanSubsaharan AfricanSudaneseSwedishSwissSyrianTaiwaneseThaiTlingit-HaidaTohono O'OdhamTonganTrinidadian and TobagonianTsimshianTurkishU.S. Virgin IslanderUgandanUkrainianUruguayanVenezuelanVietnameseWelshWest IndianYakamaYaquiYugoslavianYumanYup'ikZimbabwean
Immigration
NonimmigrantsImmigrantsAfghanistanAfricaAlbaniaArgentinaArmeniaAsiaAustraliaAustriaBahamasBangladeshBarbadosBelarusBelgiumBelizeBoliviaBosnia and HerzegovinaBrazilBulgariaBurma/MyanmarCabo VerdeCambodiaCameroonCanadaCaribbeanCentral AmericaChileChinaColombiaCongoCosta RicaCroatiaCubaCzechoslovakiaDenmarkDominicaDominican RepublicEastern AfricaEastern AsiaEastern EuropeEcuadorEgyptEl SalvadorEnglandEritreaEthiopiaEuropeFijiFranceGermanyGhanaGreeceGrenadaGuatemalaGuyanaHaitiHondurasHong KongHungaryIndiaIndonesiaIranIraqIrelandIsraelItalyJamaicaJapanJordanKazakhstanKenyaKoreaKuwaitLaosLatin AmericaLatviaLebanonLiberiaLithuaniaMalaysiaMexicoMicronesiaMiddle AfricaMoldovaMoroccoNepalNetherlandsNicaraguaNigeriaNorth AmericaNorth MacedoniaNorthern AfricaNorthern EuropeNorwayOceaniaPakistanPanamaPeruPhilippinesPolandPortugalRomaniaRussiaSaudi ArabiaScotlandSenegalSerbiaSierra LeoneSingaporeSomaliaSouth AfricaSouth AmericaSouth Central AsiaSouth Eastern AsiaSouthern EuropeSpainSri LankaSt. Vincent and the GrenadinesSudanSwedenSwitzerlandSyriaTaiwanThailandTrinidad and TobagoTurkeyUgandaUkraineUruguayUzbekistanVenezuelaVietnamWest IndiesWestern AfricaWestern AsiaWestern EuropeYemenZaireZimbabweAzores
Ute
Race
Ancestry
AfghanAfricanAlaska NativeAlaskan AthabascanAlbanianAleutAlsatianAmericanApacheArabArapahoArgentineanArmenianAssyrian/Chaldean/SyriacAustralianAustrianBahamianBangladeshiBarbadianBasqueBelgianBelizeanBermudanBhutaneseBlackfeetBolivianBrazilianBritishBritish West IndianBulgarianBurmeseCajunCambodianCanadianCape VerdeanCarpatho RusynCelticCentral AmericanCentral American IndianCherokeeCheyenneChickasawChileanChineseChippewaChoctawColombianColvilleComancheCosta RicanCreeCreekCroatianCrowCubanCypriotCzechCzechoslovakianDanishDelawareDominicanDutchDutch West IndianEastern EuropeanEcuadorianEgyptianEnglishEstonianEthiopianEuropeanFijianFilipinoFinnishFrenchFrench American IndianFrench CanadianGermanGerman RussianGhanaianGreekGuamanian/ChamorroGuatemalanGuyaneseHaitianHmongHonduranHopiHoumaHungarianIcelanderIndian (Asian)IndonesianInupiatIranianIraqiIrishIroquoisIsraeliItalianJamaicanJapaneseJordanianKenyanKiowaKoreanLaotianLatvianLebaneseLiberianLithuanianLumbeeLuxembourgerMacedonianMalaysianMalteseMarshalleseMenomineeMexicanMexican American IndianMongolianMoroccanNative HawaiianNavajoNepaleseNew ZealanderNicaraguanNigerianNorthern EuropeanNorwegianOkinawanOsageOttawaPaiutePakistaniPalestinianPanamanianParaguayanPennsylvania GermanPeruvianPimaPolishPortuguesePotawatomiPuebloPuerto RicanPuget Sound SalishRomanianRussianSalvadoranSamoanScandinavianScotch-IrishScottishSeminoleSenegaleseSerbianShoshoneSierra LeoneanSiouxSlavicSlovakSloveneSomaliSouth AfricanSouth AmericanSouth American IndianSoviet UnionSpaniardSpanishSpanish AmericanSpanish American IndianSri LankanSubsaharan AfricanSudaneseSwedishSwissSyrianTaiwaneseThaiTlingit-HaidaTohono O'OdhamTonganTrinidadian and TobagonianTsimshianTurkishU.S. Virgin IslanderUgandanUkrainianUruguayanUteVenezuelanVietnameseWelshWest IndianYakamaYaquiYugoslavianYumanYup'ikZimbabwean
Immigration
NonimmigrantsImmigrantsAfghanistanAfricaAlbaniaArgentinaArmeniaAsiaAustraliaAustriaBahamasBangladeshBarbadosBelarusBelgiumBelizeBoliviaBosnia and HerzegovinaBrazilBulgariaBurma/MyanmarCabo VerdeCambodiaCameroonCanadaCaribbeanCentral AmericaChileChinaColombiaCongoCosta RicaCroatiaCubaCzechoslovakiaDenmarkDominicaDominican RepublicEastern AfricaEastern AsiaEastern EuropeEcuadorEgyptEl SalvadorEnglandEritreaEthiopiaEuropeFijiFranceGermanyGhanaGreeceGrenadaGuatemalaGuyanaHaitiHondurasHong KongHungaryIndiaIndonesiaIranIraqIrelandIsraelItalyJamaicaJapanJordanKazakhstanKenyaKoreaKuwaitLaosLatin AmericaLatviaLebanonLiberiaLithuaniaMalaysiaMexicoMicronesiaMiddle AfricaMoldovaMoroccoNepalNetherlandsNicaraguaNigeriaNorth AmericaNorth MacedoniaNorthern AfricaNorthern EuropeNorwayOceaniaPakistanPanamaPeruPhilippinesPolandPortugalRomaniaRussiaSaudi ArabiaScotlandSenegalSerbiaSierra LeoneSingaporeSomaliaSouth AfricaSouth AmericaSouth Central AsiaSouth Eastern AsiaSouthern EuropeSpainSri LankaSt. Vincent and the GrenadinesSudanSwedenSwitzerlandSyriaTaiwanThailandTrinidad and TobagoTurkeyUgandaUkraineUruguayUzbekistanVenezuelaVietnamWest IndiesWestern AsiaWestern EuropeYemenZaireZimbabweAzores
Unemployment Among Women with Children Under 18 years
Income
Poverty
Unemployment
Labor Participation
Family Structure
Vehicle Availability
Education Level
Disability

Unemployment Among Women with Children Under 18 years Comparison

Immigrants from Western Africa

Ute

Tragic
Tragic
6.2%
UNEMPLOYMENT AMONG WOMEN WITH CHILDREN UNDER 18 YEARS
0.0/ 100
METRIC RATING
273rd/ 347
METRIC RANK
5.9%
UNEMPLOYMENT AMONG WOMEN WITH CHILDREN UNDER 18 YEARS
0.7/ 100
METRIC RATING
251st/ 347
METRIC RANK

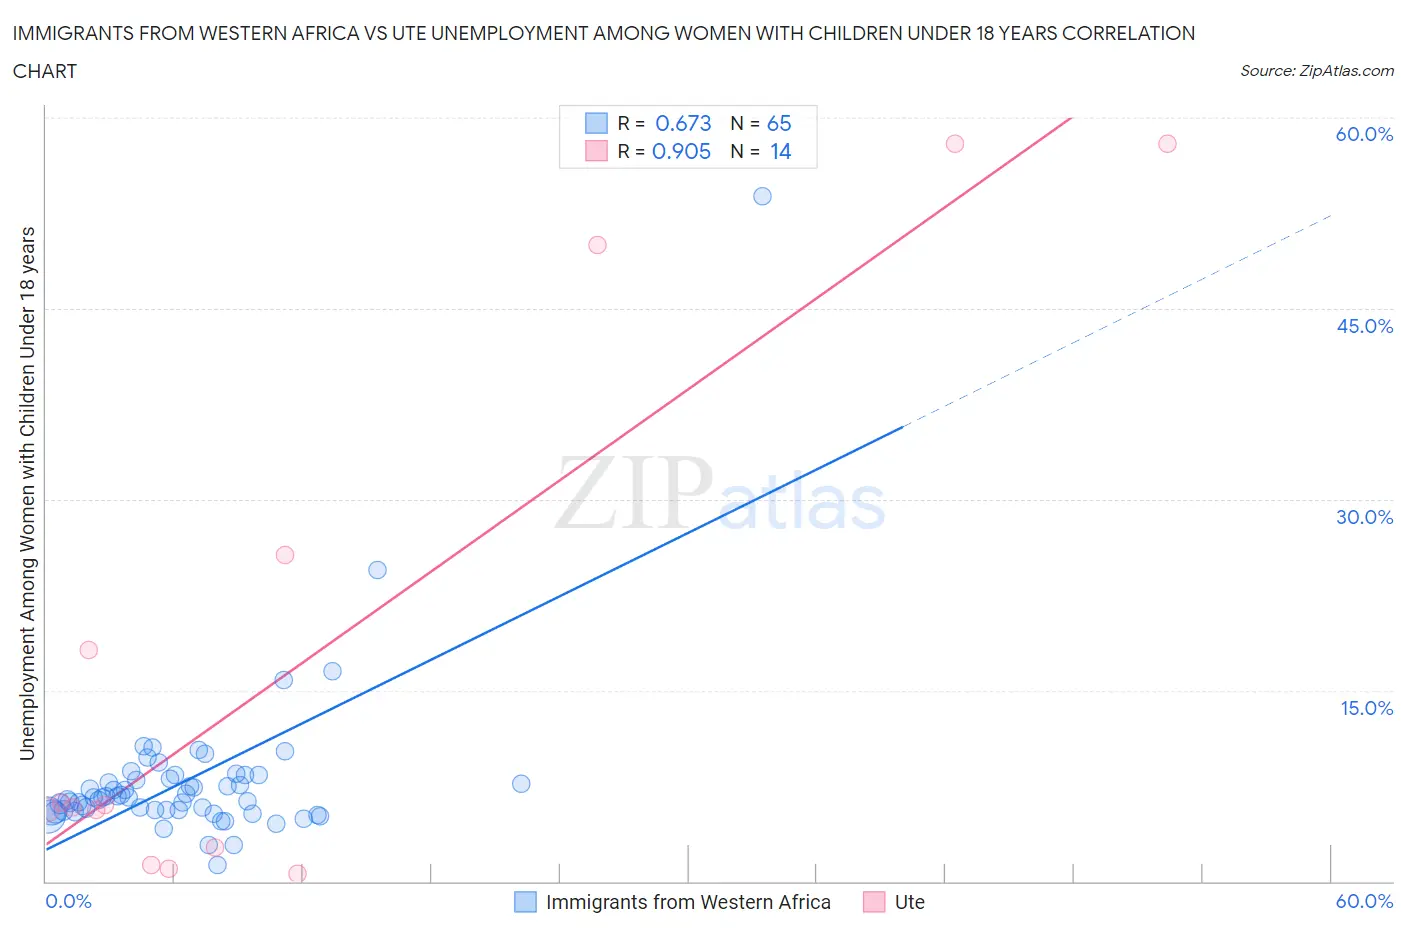
Immigrants from Western Africa vs Ute Unemployment Among Women with Children Under 18 years Correlation Chart

The statistical analysis conducted on geographies consisting of 348,138,775 people shows a significant positive correlation between the proportion of Immigrants from Western Africa and unemployment rate among women with children under the age of 18 in the United States with a correlation coefficient (R) of 0.673 and weighted average of 6.2%. Similarly, the statistical analysis conducted on geographies consisting of 55,040,080 people shows a near-perfect positive correlation between the proportion of Ute and unemployment rate among women with children under the age of 18 in the United States with a correlation coefficient (R) of 0.905 and weighted average of 5.9%, a difference of 4.9%.
Immigrants from Western Africa vs Ute Unemployment Among Women with Children Under 18 years

Unemployment Among Women with Children Under 18 years Correlation Summary

MeasurementImmigrants from Western AfricaUte
Minimum1.3%0.60%
Maximum53.8%57.9%
Range52.5%57.3%
Mean7.9%17.5%
Median6.6%5.9%
Interquartile 25% (IQ1)5.5%2.7%
Interquartile 75% (IQ3)8.2%25.6%
Interquartile Range (IQR)2.6%22.9%
Standard Deviation (Sample)6.6%21.7%
Standard Deviation (Population)6.6%20.9%

Similar Demographics by Unemployment Among Women with Children Under 18 years

Demographics Similar to Immigrants from Western Africa by Unemployment Among Women with Children Under 18 years

In terms of unemployment among women with children under 18 years, the demographic groups most similar to Immigrants from Western Africa are Senegalese (6.2%, a difference of 0.020%), Salvadoran (6.2%, a difference of 0.090%), Dutch West Indian (6.2%, a difference of 0.19%), Immigrants from Ghana (6.2%, a difference of 0.30%), and Central American (6.2%, a difference of 0.31%).
DemographicsRating | RankUnemployment Among Women with Children Under 18 years
Sub-Saharan Africans
0.1
/100
|
#266
Tragic
6.2%
French American Indians
0.1
/100
|
#267
Tragic
6.2%
Trinidadians and Tobagonians
0.1
/100
|
#268
Tragic
6.2%
Cajuns
0.1
/100
|
#269
Tragic
6.2%
Ghanaians
0.1
/100
|
#270
Tragic
6.2%
Central Americans
0.0
/100
|
#271
Tragic
6.2%
Salvadorans
0.0
/100
|
#272
Tragic
6.2%
Immigrants | Western Africa
0.0
/100
|
#273
Tragic
6.2%
Senegalese
0.0
/100
|
#274
Tragic
6.2%
Dutch West Indians
0.0
/100
|
#275
Tragic
6.2%
Immigrants | Ghana
0.0
/100
|
#276
Tragic
6.2%
Mexican American Indians
0.0
/100
|
#277
Tragic
6.2%
Immigrants | Barbados
0.0
/100
|
#278
Tragic
6.2%
Immigrants | Portugal
0.0
/100
|
#279
Tragic
6.3%
Guatemalans
0.0
/100
|
#280
Tragic
6.3%

Demographics Similar to Ute by Unemployment Among Women with Children Under 18 years

In terms of unemployment among women with children under 18 years, the demographic groups most similar to Ute are Immigrants from Cabo Verde (5.9%, a difference of 0.010%), Immigrants from Cameroon (5.9%, a difference of 0.080%), Delaware (5.9%, a difference of 0.23%), Cape Verdean (5.9%, a difference of 0.44%), and Uruguayan (5.9%, a difference of 0.52%).
DemographicsRating | RankUnemployment Among Women with Children Under 18 years
Choctaw
1.1
/100
|
#244
Tragic
5.9%
Ugandans
1.1
/100
|
#245
Tragic
5.9%
Uruguayans
1.0
/100
|
#246
Tragic
5.9%
Cape Verdeans
1.0
/100
|
#247
Tragic
5.9%
Delaware
0.8
/100
|
#248
Tragic
5.9%
Immigrants | Cameroon
0.8
/100
|
#249
Tragic
5.9%
Immigrants | Cabo Verde
0.7
/100
|
#250
Tragic
5.9%
Ute
0.7
/100
|
#251
Tragic
5.9%
Seminole
0.5
/100
|
#252
Tragic
6.0%
Immigrants | Congo
0.4
/100
|
#253
Tragic
6.0%
Immigrants | Azores
0.3
/100
|
#254
Tragic
6.0%
Liberians
0.2
/100
|
#255
Tragic
6.0%
Nepalese
0.2
/100
|
#256
Tragic
6.0%
Bermudans
0.1
/100
|
#257
Tragic
6.1%
Immigrants | Nigeria
0.1
/100
|
#258
Tragic
6.1%