Immigrants from Western Africa vs Ute 3rd Grade

COMPARE

Immigrants from Western Africa
Race
Ancestry
AfghanAfricanAlaska NativeAlaskan AthabascanAlbanianAleutAlsatianAmericanApacheArabArapahoArgentineanArmenianAssyrian/Chaldean/SyriacAustralianAustrianBahamianBangladeshiBarbadianBasqueBelgianBelizeanBermudanBhutaneseBlackfeetBolivianBrazilianBritishBritish West IndianBulgarianBurmeseCajunCambodianCanadianCape VerdeanCarpatho RusynCelticCentral AmericanCentral American IndianCherokeeCheyenneChickasawChileanChineseChippewaChoctawColombianColvilleComancheCosta RicanCreeCreekCroatianCrowCubanCypriotCzechCzechoslovakianDanishDelawareDominicanDutchDutch West IndianEastern EuropeanEcuadorianEgyptianEnglishEstonianEthiopianEuropeanFijianFilipinoFinnishFrenchFrench American IndianFrench CanadianGermanGerman RussianGhanaianGreekGuamanian/ChamorroGuatemalanGuyaneseHaitianHmongHonduranHopiHoumaHungarianIcelanderIndian (Asian)IndonesianInupiatIranianIraqiIrishIroquoisIsraeliItalianJamaicanJapaneseJordanianKenyanKiowaKoreanLaotianLatvianLebaneseLiberianLithuanianLumbeeLuxembourgerMacedonianMalaysianMalteseMarshalleseMenomineeMexicanMexican American IndianMongolianMoroccanNative HawaiianNavajoNepaleseNew ZealanderNicaraguanNigerianNorthern EuropeanNorwegianOkinawanOsageOttawaPaiutePakistaniPalestinianPanamanianParaguayanPennsylvania GermanPeruvianPimaPolishPortuguesePotawatomiPuebloPuerto RicanPuget Sound SalishRomanianRussianSalvadoranSamoanScandinavianScotch-IrishScottishSeminoleSenegaleseSerbianShoshoneSierra LeoneanSiouxSlavicSlovakSloveneSomaliSouth AfricanSouth AmericanSouth American IndianSoviet UnionSpaniardSpanishSpanish AmericanSpanish American IndianSri LankanSubsaharan AfricanSudaneseSwedishSwissSyrianTaiwaneseThaiTlingit-HaidaTohono O'OdhamTonganTrinidadian and TobagonianTsimshianTurkishU.S. Virgin IslanderUgandanUkrainianUruguayanVenezuelanVietnameseWelshWest IndianYakamaYaquiYugoslavianYumanYup'ikZimbabwean
Immigration
NonimmigrantsImmigrantsAfghanistanAfricaAlbaniaArgentinaArmeniaAsiaAustraliaAustriaBahamasBangladeshBarbadosBelarusBelgiumBelizeBoliviaBosnia and HerzegovinaBrazilBulgariaBurma/MyanmarCabo VerdeCambodiaCameroonCanadaCaribbeanCentral AmericaChileChinaColombiaCongoCosta RicaCroatiaCubaCzechoslovakiaDenmarkDominicaDominican RepublicEastern AfricaEastern AsiaEastern EuropeEcuadorEgyptEl SalvadorEnglandEritreaEthiopiaEuropeFijiFranceGermanyGhanaGreeceGrenadaGuatemalaGuyanaHaitiHondurasHong KongHungaryIndiaIndonesiaIranIraqIrelandIsraelItalyJamaicaJapanJordanKazakhstanKenyaKoreaKuwaitLaosLatin AmericaLatviaLebanonLiberiaLithuaniaMalaysiaMexicoMicronesiaMiddle AfricaMoldovaMoroccoNepalNetherlandsNicaraguaNigeriaNorth AmericaNorth MacedoniaNorthern AfricaNorthern EuropeNorwayOceaniaPakistanPanamaPeruPhilippinesPolandPortugalRomaniaRussiaSaudi ArabiaScotlandSenegalSerbiaSierra LeoneSingaporeSomaliaSouth AfricaSouth AmericaSouth Central AsiaSouth Eastern AsiaSouthern EuropeSpainSri LankaSt. Vincent and the GrenadinesSudanSwedenSwitzerlandSyriaTaiwanThailandTrinidad and TobagoTurkeyUgandaUkraineUruguayUzbekistanVenezuelaVietnamWest IndiesWestern AfricaWestern AsiaWestern EuropeYemenZaireZimbabweAzores
Ute
Race
Ancestry
AfghanAfricanAlaska NativeAlaskan AthabascanAlbanianAleutAlsatianAmericanApacheArabArapahoArgentineanArmenianAssyrian/Chaldean/SyriacAustralianAustrianBahamianBangladeshiBarbadianBasqueBelgianBelizeanBermudanBhutaneseBlackfeetBolivianBrazilianBritishBritish West IndianBulgarianBurmeseCajunCambodianCanadianCape VerdeanCarpatho RusynCelticCentral AmericanCentral American IndianCherokeeCheyenneChickasawChileanChineseChippewaChoctawColombianColvilleComancheCosta RicanCreeCreekCroatianCrowCubanCypriotCzechCzechoslovakianDanishDelawareDominicanDutchDutch West IndianEastern EuropeanEcuadorianEgyptianEnglishEstonianEthiopianEuropeanFijianFilipinoFinnishFrenchFrench American IndianFrench CanadianGermanGerman RussianGhanaianGreekGuamanian/ChamorroGuatemalanGuyaneseHaitianHmongHonduranHopiHoumaHungarianIcelanderIndian (Asian)IndonesianInupiatIranianIraqiIrishIroquoisIsraeliItalianJamaicanJapaneseJordanianKenyanKiowaKoreanLaotianLatvianLebaneseLiberianLithuanianLumbeeLuxembourgerMacedonianMalaysianMalteseMarshalleseMenomineeMexicanMexican American IndianMongolianMoroccanNative HawaiianNavajoNepaleseNew ZealanderNicaraguanNigerianNorthern EuropeanNorwegianOkinawanOsageOttawaPaiutePakistaniPalestinianPanamanianParaguayanPennsylvania GermanPeruvianPimaPolishPortuguesePotawatomiPuebloPuerto RicanPuget Sound SalishRomanianRussianSalvadoranSamoanScandinavianScotch-IrishScottishSeminoleSenegaleseSerbianShoshoneSierra LeoneanSiouxSlavicSlovakSloveneSomaliSouth AfricanSouth AmericanSouth American IndianSoviet UnionSpaniardSpanishSpanish AmericanSpanish American IndianSri LankanSubsaharan AfricanSudaneseSwedishSwissSyrianTaiwaneseThaiTlingit-HaidaTohono O'OdhamTonganTrinidadian and TobagonianTsimshianTurkishU.S. Virgin IslanderUgandanUkrainianUruguayanUteVenezuelanVietnameseWelshWest IndianYakamaYaquiYugoslavianYumanYup'ikZimbabwean
Immigration
NonimmigrantsImmigrantsAfghanistanAfricaAlbaniaArgentinaArmeniaAsiaAustraliaAustriaBahamasBangladeshBarbadosBelarusBelgiumBelizeBoliviaBosnia and HerzegovinaBrazilBulgariaBurma/MyanmarCabo VerdeCambodiaCameroonCanadaCaribbeanCentral AmericaChileChinaColombiaCongoCosta RicaCroatiaCubaCzechoslovakiaDenmarkDominicaDominican RepublicEastern AfricaEastern AsiaEastern EuropeEcuadorEgyptEl SalvadorEnglandEritreaEthiopiaEuropeFijiFranceGermanyGhanaGreeceGrenadaGuatemalaGuyanaHaitiHondurasHong KongHungaryIndiaIndonesiaIranIraqIrelandIsraelItalyJamaicaJapanJordanKazakhstanKenyaKoreaKuwaitLaosLatin AmericaLatviaLebanonLiberiaLithuaniaMalaysiaMexicoMicronesiaMiddle AfricaMoldovaMoroccoNepalNetherlandsNicaraguaNigeriaNorth AmericaNorth MacedoniaNorthern AfricaNorthern EuropeNorwayOceaniaPakistanPanamaPeruPhilippinesPolandPortugalRomaniaRussiaSaudi ArabiaScotlandSenegalSerbiaSierra LeoneSingaporeSomaliaSouth AfricaSouth AmericaSouth Central AsiaSouth Eastern AsiaSouthern EuropeSpainSri LankaSt. Vincent and the GrenadinesSudanSwedenSwitzerlandSyriaTaiwanThailandTrinidad and TobagoTurkeyUgandaUkraineUruguayUzbekistanVenezuelaVietnamWest IndiesWestern AsiaWestern EuropeYemenZaireZimbabweAzores
3rd Grade
Income
Poverty
Unemployment
Labor Participation
Family Structure
Vehicle Availability
Education Level
Disability

3rd Grade Comparison

Immigrants from Western Africa

Ute

Tragic
Exceptional
97.2%
3RD GRADE
0.1/ 100
METRIC RATING
278th/ 347
METRIC RANK
98.0%
3RD GRADE
93.2/ 100
METRIC RATING
127th/ 347
METRIC RANK

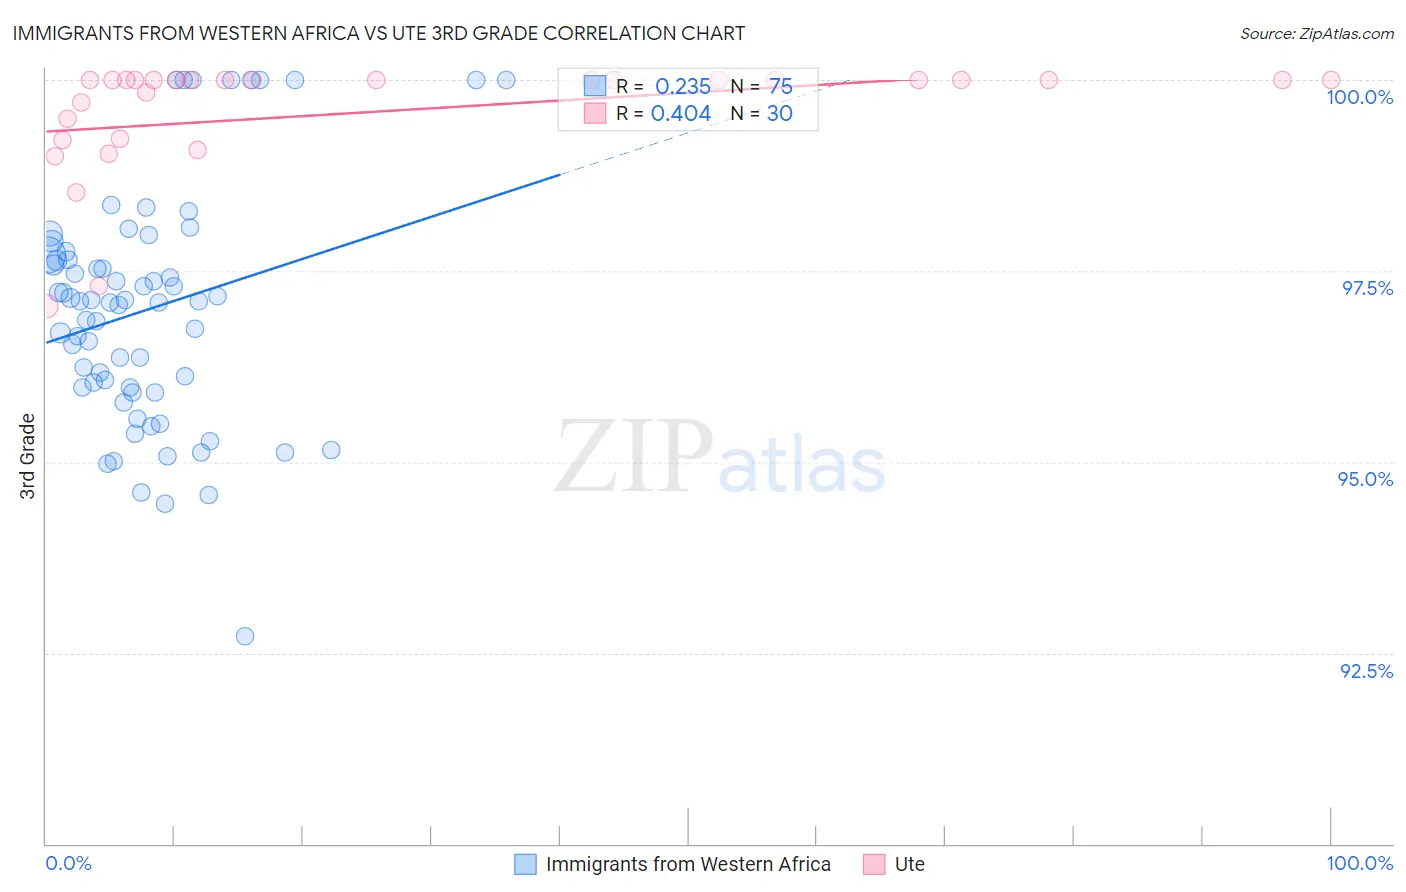
Immigrants from Western Africa vs Ute 3rd Grade Correlation Chart

The statistical analysis conducted on geographies consisting of 357,811,354 people shows a weak positive correlation between the proportion of Immigrants from Western Africa and percentage of population with at least 3rd grade education in the United States with a correlation coefficient (R) of 0.235 and weighted average of 97.2%. Similarly, the statistical analysis conducted on geographies consisting of 55,667,712 people shows a moderate positive correlation between the proportion of Ute and percentage of population with at least 3rd grade education in the United States with a correlation coefficient (R) of 0.404 and weighted average of 98.0%, a difference of 0.83%.
Immigrants from Western Africa vs Ute 3rd Grade

3rd Grade Correlation Summary

MeasurementImmigrants from Western AfricaUte
Minimum92.7%97.0%
Maximum100.0%100.0%
Range7.3%3.0%
Mean97.0%99.6%
Median97.1%100.0%
Interquartile 25% (IQ1)96.0%99.2%
Interquartile 75% (IQ3)97.7%100.0%
Interquartile Range (IQR)1.7%0.77%
Standard Deviation (Sample)1.5%0.77%
Standard Deviation (Population)1.5%0.76%

Similar Demographics by 3rd Grade

Demographics Similar to Immigrants from Western Africa by 3rd Grade

In terms of 3rd grade, the demographic groups most similar to Immigrants from Western Africa are Immigrants from Bolivia (97.2%, a difference of 0.0%), Trinidadian and Tobagonian (97.2%, a difference of 0.0%), Immigrants from Philippines (97.2%, a difference of 0.010%), Immigrants from Ghana (97.2%, a difference of 0.010%), and Immigrants from Uzbekistan (97.2%, a difference of 0.020%).
DemographicsRating | Rank3rd Grade
Puerto Ricans
0.2
/100
|
#271
Tragic
97.2%
Ghanaians
0.1
/100
|
#272
Tragic
97.2%
Immigrants | Peru
0.1
/100
|
#273
Tragic
97.2%
Immigrants | Cameroon
0.1
/100
|
#274
Tragic
97.2%
Immigrants | Uzbekistan
0.1
/100
|
#275
Tragic
97.2%
Immigrants | Bolivia
0.1
/100
|
#276
Tragic
97.2%
Trinidadians and Tobagonians
0.1
/100
|
#277
Tragic
97.2%
Immigrants | Western Africa
0.1
/100
|
#278
Tragic
97.2%
Immigrants | Philippines
0.1
/100
|
#279
Tragic
97.2%
Immigrants | Ghana
0.1
/100
|
#280
Tragic
97.2%
Barbadians
0.1
/100
|
#281
Tragic
97.2%
Afghans
0.1
/100
|
#282
Tragic
97.1%
Houma
0.1
/100
|
#283
Tragic
97.1%
Immigrants | Trinidad and Tobago
0.0
/100
|
#284
Tragic
97.1%
Immigrants | Hong Kong
0.0
/100
|
#285
Tragic
97.1%

Demographics Similar to Ute by 3rd Grade

In terms of 3rd grade, the demographic groups most similar to Ute are Immigrants from Saudi Arabia (98.0%, a difference of 0.0%), Immigrants from Zimbabwe (98.0%, a difference of 0.0%), Iroquois (98.0%, a difference of 0.010%), Lebanese (98.0%, a difference of 0.010%), and Syrian (98.0%, a difference of 0.010%).
DemographicsRating | Rank3rd Grade
Immigrants | Croatia
94.4
/100
|
#120
Exceptional
98.0%
Iroquois
94.1
/100
|
#121
Exceptional
98.0%
Lebanese
94.1
/100
|
#122
Exceptional
98.0%
Syrians
93.8
/100
|
#123
Exceptional
98.0%
Immigrants | Japan
93.7
/100
|
#124
Exceptional
98.0%
Immigrants | Saudi Arabia
93.5
/100
|
#125
Exceptional
98.0%
Immigrants | Zimbabwe
93.4
/100
|
#126
Exceptional
98.0%
Ute
93.2
/100
|
#127
Exceptional
98.0%
Colville
92.1
/100
|
#128
Exceptional
98.0%
Immigrants | Serbia
91.9
/100
|
#129
Exceptional
98.0%
Immigrants | Europe
91.2
/100
|
#130
Exceptional
98.0%
Immigrants | Bulgaria
89.1
/100
|
#131
Excellent
97.9%
Immigrants | Hungary
88.8
/100
|
#132
Excellent
97.9%
Immigrants | Kuwait
88.7
/100
|
#133
Excellent
97.9%
Seminole
88.7
/100
|
#134
Excellent
97.9%