Immigrants from Vietnam vs English Unemployment Among Ages 45 to 54 years
COMPARE
Immigrants from Vietnam
English
Unemployment Among Ages 45 to 54 years
Unemployment Among Ages 45 to 54 years Comparison
Immigrants from Vietnam
English
4.4%
UNEMPLOYMENT AMONG AGES 45 TO 54 YEARS
88.6/ 100
METRIC RATING
125th/ 347
METRIC RANK
4.1%
UNEMPLOYMENT AMONG AGES 45 TO 54 YEARS
100.0/ 100
METRIC RATING
20th/ 347
METRIC RANK
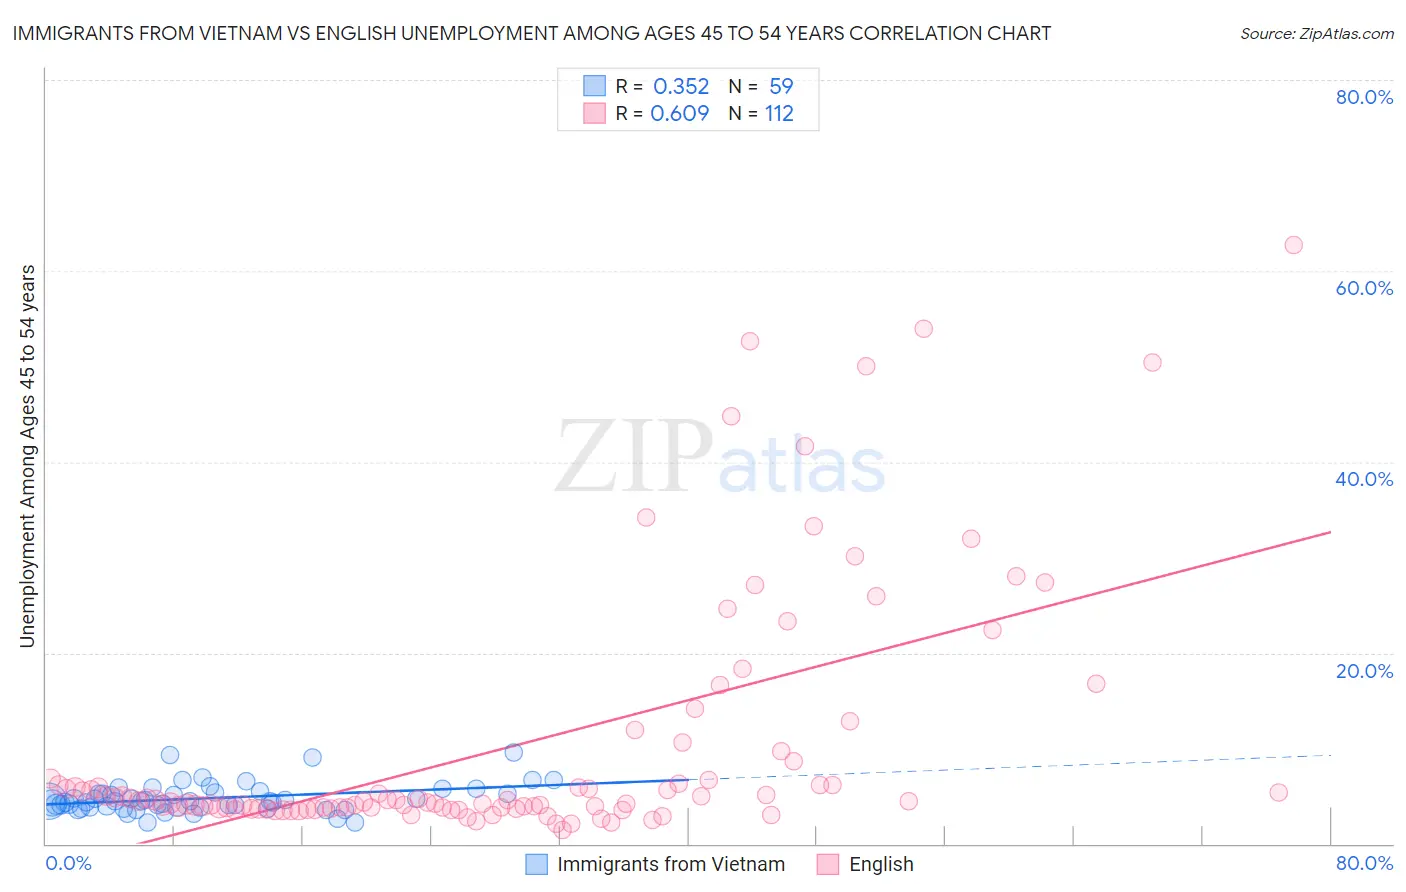
Immigrants from Vietnam vs English Unemployment Among Ages 45 to 54 years Correlation Chart
The statistical analysis conducted on geographies consisting of 395,419,223 people shows a mild positive correlation between the proportion of Immigrants from Vietnam and unemployment rate among population between the ages 45 and 54 in the United States with a correlation coefficient (R) of 0.352 and weighted average of 4.4%. Similarly, the statistical analysis conducted on geographies consisting of 532,314,880 people shows a significant positive correlation between the proportion of English and unemployment rate among population between the ages 45 and 54 in the United States with a correlation coefficient (R) of 0.609 and weighted average of 4.1%, a difference of 8.4%.
Unemployment Among Ages 45 to 54 years Correlation Summary
| Measurement | Immigrants from Vietnam | English |
| Minimum | 2.2% | 1.4% |
| Maximum | 9.6% | 62.7% |
| Range | 7.4% | 61.3% |
| Mean | 4.8% | 10.2% |
| Median | 4.4% | 4.5% |
| Interquartile 25% (IQ1) | 3.8% | 3.7% |
| Interquartile 75% (IQ3) | 5.4% | 6.7% |
| Interquartile Range (IQR) | 1.6% | 3.0% |
| Standard Deviation (Sample) | 1.5% | 13.0% |
| Standard Deviation (Population) | 1.5% | 13.0% |
Similar Demographics by Unemployment Among Ages 45 to 54 years
Demographics Similar to Immigrants from Vietnam by Unemployment Among Ages 45 to 54 years
In terms of unemployment among ages 45 to 54 years, the demographic groups most similar to Immigrants from Vietnam are Immigrants from Asia (4.4%, a difference of 0.020%), Spanish (4.4%, a difference of 0.020%), Immigrants from Czechoslovakia (4.4%, a difference of 0.10%), Immigrants from Oceania (4.4%, a difference of 0.11%), and Immigrants from Kazakhstan (4.4%, a difference of 0.11%).
| Demographics | Rating | Rank | Unemployment Among Ages 45 to 54 years |
| Immigrants | Romania | 90.0 /100 | #118 | Exceptional 4.4% |
| Native Hawaiians | 90.0 /100 | #119 | Excellent 4.4% |
| Americans | 89.6 /100 | #120 | Excellent 4.4% |
| Immigrants | Oceania | 89.5 /100 | #121 | Excellent 4.4% |
| Immigrants | Kazakhstan | 89.5 /100 | #122 | Excellent 4.4% |
| Immigrants | Asia | 88.8 /100 | #123 | Excellent 4.4% |
| Spanish | 88.8 /100 | #124 | Excellent 4.4% |
| Immigrants | Vietnam | 88.6 /100 | #125 | Excellent 4.4% |
| Immigrants | Czechoslovakia | 87.8 /100 | #126 | Excellent 4.4% |
| Nicaraguans | 87.6 /100 | #127 | Excellent 4.4% |
| Immigrants | Northern Europe | 86.9 /100 | #128 | Excellent 4.4% |
| Laotians | 86.3 /100 | #129 | Excellent 4.4% |
| Celtics | 86.2 /100 | #130 | Excellent 4.4% |
| Immigrants | Germany | 85.9 /100 | #131 | Excellent 4.4% |
| Immigrants | Eastern Africa | 85.1 /100 | #132 | Excellent 4.4% |
Demographics Similar to English by Unemployment Among Ages 45 to 54 years
In terms of unemployment among ages 45 to 54 years, the demographic groups most similar to English are Swiss (4.1%, a difference of 0.16%), European (4.1%, a difference of 0.33%), Yugoslavian (4.1%, a difference of 0.42%), Bulgarian (4.1%, a difference of 0.42%), and German (4.1%, a difference of 0.45%).
| Demographics | Rating | Rank | Unemployment Among Ages 45 to 54 years |
| Cubans | 100.0 /100 | #13 | Exceptional 4.0% |
| Immigrants | Bosnia and Herzegovina | 100.0 /100 | #14 | Exceptional 4.0% |
| Immigrants | Bolivia | 100.0 /100 | #15 | Exceptional 4.0% |
| Thais | 100.0 /100 | #16 | Exceptional 4.0% |
| Tongans | 100.0 /100 | #17 | Exceptional 4.1% |
| Germans | 100.0 /100 | #18 | Exceptional 4.1% |
| Swiss | 100.0 /100 | #19 | Exceptional 4.1% |
| English | 100.0 /100 | #20 | Exceptional 4.1% |
| Europeans | 100.0 /100 | #21 | Exceptional 4.1% |
| Yugoslavians | 100.0 /100 | #22 | Exceptional 4.1% |
| Bulgarians | 100.0 /100 | #23 | Exceptional 4.1% |
| Carpatho Rusyns | 100.0 /100 | #24 | Exceptional 4.1% |
| Bolivians | 99.9 /100 | #25 | Exceptional 4.1% |
| Scottish | 99.9 /100 | #26 | Exceptional 4.1% |
| Immigrants | Moldova | 99.9 /100 | #27 | Exceptional 4.1% |