Immigrants from Vietnam vs Bangladeshi Unemployment Among Ages 45 to 54 years

COMPARE

Immigrants from Vietnam
Race
Ancestry
AfghanAfricanAlaska NativeAlaskan AthabascanAlbanianAleutAlsatianAmericanApacheArabArapahoArgentineanArmenianAssyrian/Chaldean/SyriacAustralianAustrianBahamianBarbadianBasqueBelgianBelizeanBermudanBhutaneseBlackfeetBolivianBrazilianBritishBritish West IndianBulgarianBurmeseCajunCambodianCanadianCape VerdeanCarpatho RusynCelticCentral AmericanCentral American IndianCherokeeCheyenneChickasawChileanChineseChippewaChoctawColombianColvilleComancheCosta RicanCreeCreekCroatianCrowCubanCypriotCzechCzechoslovakianDanishDelawareDominicanDutchDutch West IndianEastern EuropeanEcuadorianEgyptianEnglishEstonianEthiopianEuropeanFijianFilipinoFinnishFrenchFrench American IndianFrench CanadianGermanGerman RussianGhanaianGreekGuamanian/ChamorroGuatemalanGuyaneseHaitianHmongHonduranHopiHoumaHungarianIcelanderIndian (Asian)IndonesianInupiatIranianIraqiIrishIroquoisIsraeliItalianJamaicanJapaneseJordanianKenyanKiowaKoreanLaotianLatvianLebaneseLiberianLithuanianLumbeeLuxembourgerMacedonianMalaysianMalteseMarshalleseMenomineeMexicanMexican American IndianMongolianMoroccanNative HawaiianNavajoNepaleseNew ZealanderNicaraguanNigerianNorthern EuropeanNorwegianOkinawanOsageOttawaPaiutePakistaniPalestinianPanamanianParaguayanPennsylvania GermanPeruvianPimaPolishPortuguesePotawatomiPuebloPuerto RicanPuget Sound SalishRomanianRussianSalvadoranSamoanScandinavianScotch-IrishScottishSeminoleSenegaleseSerbianShoshoneSierra LeoneanSiouxSlavicSlovakSloveneSomaliSouth AfricanSouth AmericanSouth American IndianSoviet UnionSpaniardSpanishSpanish AmericanSpanish American IndianSri LankanSubsaharan AfricanSudaneseSwedishSwissSyrianTaiwaneseThaiTlingit-HaidaTohono O'OdhamTonganTrinidadian and TobagonianTsimshianTurkishU.S. Virgin IslanderUgandanUkrainianUruguayanUteVenezuelanVietnameseWelshWest IndianYakamaYaquiYugoslavianYumanYup'ikZimbabwean
Immigration
NonimmigrantsImmigrantsAfghanistanAfricaAlbaniaArgentinaArmeniaAsiaAustraliaAustriaBahamasBangladeshBarbadosBelarusBelgiumBelizeBoliviaBosnia and HerzegovinaBrazilBulgariaBurma/MyanmarCabo VerdeCambodiaCameroonCanadaCaribbeanCentral AmericaChileChinaColombiaCongoCosta RicaCroatiaCubaCzechoslovakiaDenmarkDominicaDominican RepublicEastern AfricaEastern AsiaEastern EuropeEcuadorEgyptEl SalvadorEnglandEritreaEthiopiaEuropeFijiFranceGermanyGhanaGreeceGrenadaGuatemalaGuyanaHaitiHondurasHong KongHungaryIndiaIndonesiaIranIraqIrelandIsraelItalyJamaicaJapanJordanKazakhstanKenyaKoreaKuwaitLaosLatin AmericaLatviaLebanonLiberiaLithuaniaMalaysiaMexicoMicronesiaMiddle AfricaMoldovaMoroccoNepalNetherlandsNicaraguaNigeriaNorth AmericaNorth MacedoniaNorthern AfricaNorthern EuropeNorwayOceaniaPakistanPanamaPeruPhilippinesPolandPortugalRomaniaRussiaSaudi ArabiaScotlandSenegalSerbiaSierra LeoneSingaporeSomaliaSouth AfricaSouth AmericaSouth Central AsiaSouth Eastern AsiaSouthern EuropeSpainSri LankaSt. Vincent and the GrenadinesSudanSwedenSwitzerlandSyriaTaiwanThailandTrinidad and TobagoTurkeyUgandaUkraineUruguayUzbekistanVenezuelaVietnamWest IndiesWestern AfricaWestern AsiaWestern EuropeYemenZaireZimbabweAzores
Bangladeshi
Race
Ancestry
AfghanAfricanAlaska NativeAlaskan AthabascanAlbanianAleutAlsatianAmericanApacheArabArapahoArgentineanArmenianAssyrian/Chaldean/SyriacAustralianAustrianBahamianBangladeshiBarbadianBasqueBelgianBelizeanBermudanBhutaneseBlackfeetBolivianBrazilianBritishBritish West IndianBulgarianBurmeseCajunCambodianCanadianCape VerdeanCarpatho RusynCelticCentral AmericanCentral American IndianCherokeeCheyenneChickasawChileanChineseChippewaChoctawColombianColvilleComancheCosta RicanCreeCreekCroatianCrowCubanCypriotCzechCzechoslovakianDanishDelawareDominicanDutchDutch West IndianEastern EuropeanEcuadorianEgyptianEnglishEstonianEthiopianEuropeanFijianFilipinoFinnishFrenchFrench American IndianFrench CanadianGermanGerman RussianGhanaianGreekGuamanian/ChamorroGuatemalanGuyaneseHaitianHmongHonduranHopiHoumaHungarianIcelanderIndian (Asian)IndonesianInupiatIranianIraqiIrishIroquoisIsraeliItalianJamaicanJapaneseJordanianKenyanKiowaKoreanLaotianLatvianLebaneseLiberianLithuanianLumbeeLuxembourgerMacedonianMalaysianMalteseMarshalleseMenomineeMexicanMexican American IndianMongolianMoroccanNative HawaiianNavajoNepaleseNew ZealanderNicaraguanNigerianNorthern EuropeanNorwegianOkinawanOsageOttawaPaiutePakistaniPalestinianPanamanianParaguayanPennsylvania GermanPeruvianPimaPolishPortuguesePotawatomiPuebloPuerto RicanPuget Sound SalishRomanianRussianSalvadoranSamoanScandinavianScotch-IrishScottishSeminoleSenegaleseSerbianShoshoneSierra LeoneanSiouxSlavicSlovakSloveneSomaliSouth AfricanSouth AmericanSouth American IndianSoviet UnionSpaniardSpanishSpanish AmericanSpanish American IndianSri LankanSubsaharan AfricanSudaneseSwedishSwissSyrianTaiwaneseThaiTlingit-HaidaTohono O'OdhamTonganTrinidadian and TobagonianTsimshianTurkishU.S. Virgin IslanderUgandanUkrainianUruguayanUteVenezuelanVietnameseWelshWest IndianYakamaYaquiYugoslavianYumanYup'ikZimbabwean
Immigration
NonimmigrantsImmigrantsAfghanistanAfricaAlbaniaArgentinaArmeniaAsiaAustraliaAustriaBahamasBangladeshBarbadosBelarusBelgiumBelizeBoliviaBosnia and HerzegovinaBrazilBulgariaBurma/MyanmarCabo VerdeCambodiaCameroonCanadaCaribbeanCentral AmericaChileChinaColombiaCongoCosta RicaCroatiaCubaCzechoslovakiaDenmarkDominicaDominican RepublicEastern AfricaEastern AsiaEastern EuropeEcuadorEgyptEl SalvadorEnglandEritreaEthiopiaEuropeFijiFranceGermanyGhanaGreeceGrenadaGuatemalaGuyanaHaitiHondurasHong KongHungaryIndiaIndonesiaIranIraqIrelandIsraelItalyJamaicaJapanJordanKazakhstanKenyaKoreaKuwaitLaosLatin AmericaLatviaLebanonLiberiaLithuaniaMalaysiaMexicoMicronesiaMiddle AfricaMoldovaMoroccoNepalNetherlandsNicaraguaNigeriaNorth AmericaNorth MacedoniaNorthern AfricaNorthern EuropeNorwayOceaniaPakistanPanamaPeruPhilippinesPolandPortugalRomaniaRussiaSaudi ArabiaScotlandSenegalSerbiaSierra LeoneSingaporeSomaliaSouth AfricaSouth AmericaSouth Central AsiaSouth Eastern AsiaSouthern EuropeSpainSri LankaSt. Vincent and the GrenadinesSudanSwedenSwitzerlandSyriaTaiwanThailandTrinidad and TobagoTurkeyUgandaUkraineUruguayUzbekistanVenezuelaWest IndiesWestern AfricaWestern AsiaWestern EuropeYemenZaireZimbabweAzores
Unemployment Among Ages 45 to 54 years
Income
Poverty
Unemployment
Labor Participation
Family Structure
Vehicle Availability
Education Level
Disability

Unemployment Among Ages 45 to 54 years Comparison

Immigrants from Vietnam

Bangladeshis

Excellent
Average
4.4%
UNEMPLOYMENT AMONG AGES 45 TO 54 YEARS
88.6/ 100
METRIC RATING
125th/ 347
METRIC RANK
4.5%
UNEMPLOYMENT AMONG AGES 45 TO 54 YEARS
59.7/ 100
METRIC RATING
163rd/ 347
METRIC RANK

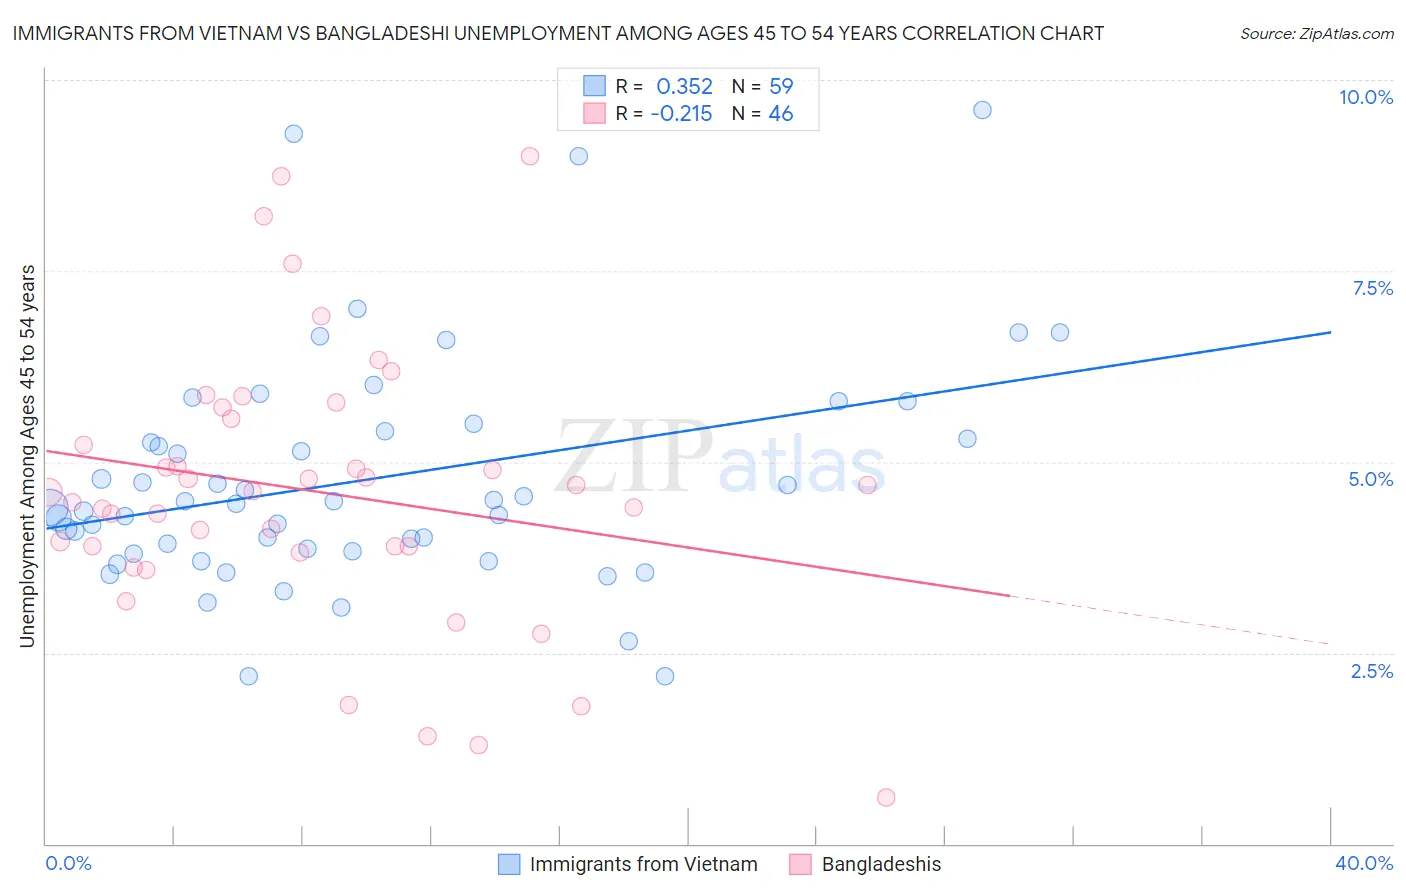
Immigrants from Vietnam vs Bangladeshi Unemployment Among Ages 45 to 54 years Correlation Chart

The statistical analysis conducted on geographies consisting of 395,419,223 people shows a mild positive correlation between the proportion of Immigrants from Vietnam and unemployment rate among population between the ages 45 and 54 in the United States with a correlation coefficient (R) of 0.352 and weighted average of 4.4%. Similarly, the statistical analysis conducted on geographies consisting of 139,604,321 people shows a weak negative correlation between the proportion of Bangladeshis and unemployment rate among population between the ages 45 and 54 in the United States with a correlation coefficient (R) of -0.215 and weighted average of 4.5%, a difference of 2.0%.
Immigrants from Vietnam vs Bangladeshi Unemployment Among Ages 45 to 54 years

Unemployment Among Ages 45 to 54 years Correlation Summary

MeasurementImmigrants from VietnamBangladeshi
Minimum2.2%0.60%
Maximum9.6%9.0%
Range7.4%8.4%
Mean4.8%4.6%
Median4.4%4.6%
Interquartile 25% (IQ1)3.8%3.9%
Interquartile 75% (IQ3)5.4%5.6%
Interquartile Range (IQR)1.6%1.7%
Standard Deviation (Sample)1.5%1.8%
Standard Deviation (Population)1.5%1.8%

Similar Demographics by Unemployment Among Ages 45 to 54 years

Demographics Similar to Immigrants from Vietnam by Unemployment Among Ages 45 to 54 years

In terms of unemployment among ages 45 to 54 years, the demographic groups most similar to Immigrants from Vietnam are Immigrants from Asia (4.4%, a difference of 0.020%), Spanish (4.4%, a difference of 0.020%), Immigrants from Czechoslovakia (4.4%, a difference of 0.10%), Immigrants from Oceania (4.4%, a difference of 0.11%), and Immigrants from Kazakhstan (4.4%, a difference of 0.11%).
DemographicsRating | RankUnemployment Among Ages 45 to 54 years
Immigrants | Romania
90.0
/100
|
#118
Exceptional
4.4%
Native Hawaiians
90.0
/100
|
#119
Excellent
4.4%
Americans
89.6
/100
|
#120
Excellent
4.4%
Immigrants | Oceania
89.5
/100
|
#121
Excellent
4.4%
Immigrants | Kazakhstan
89.5
/100
|
#122
Excellent
4.4%
Immigrants | Asia
88.8
/100
|
#123
Excellent
4.4%
Spanish
88.8
/100
|
#124
Excellent
4.4%
Immigrants | Vietnam
88.6
/100
|
#125
Excellent
4.4%
Immigrants | Czechoslovakia
87.8
/100
|
#126
Excellent
4.4%
Nicaraguans
87.6
/100
|
#127
Excellent
4.4%
Immigrants | Northern Europe
86.9
/100
|
#128
Excellent
4.4%
Laotians
86.3
/100
|
#129
Excellent
4.4%
Celtics
86.2
/100
|
#130
Excellent
4.4%
Immigrants | Germany
85.9
/100
|
#131
Excellent
4.4%
Immigrants | Eastern Africa
85.1
/100
|
#132
Excellent
4.4%

Demographics Similar to Bangladeshis by Unemployment Among Ages 45 to 54 years

In terms of unemployment among ages 45 to 54 years, the demographic groups most similar to Bangladeshis are Immigrants from Indonesia (4.5%, a difference of 0.030%), Samoan (4.5%, a difference of 0.060%), Immigrants from Eastern Europe (4.5%, a difference of 0.090%), Maltese (4.5%, a difference of 0.090%), and Immigrants from South Eastern Asia (4.5%, a difference of 0.11%).
DemographicsRating | RankUnemployment Among Ages 45 to 54 years
Immigrants | Croatia
69.6
/100
|
#156
Good
4.5%
Indians (Asian)
68.1
/100
|
#157
Good
4.5%
Immigrants | Italy
65.5
/100
|
#158
Good
4.5%
Immigrants | Nonimmigrants
62.8
/100
|
#159
Good
4.5%
Immigrants | South Eastern Asia
62.0
/100
|
#160
Good
4.5%
Immigrants | Eastern Europe
61.6
/100
|
#161
Good
4.5%
Immigrants | Indonesia
60.3
/100
|
#162
Good
4.5%
Bangladeshis
59.7
/100
|
#163
Average
4.5%
Samoans
58.5
/100
|
#164
Average
4.5%
Maltese
57.9
/100
|
#165
Average
4.5%
Immigrants | Western Europe
57.4
/100
|
#166
Average
4.5%
Immigrants | Brazil
56.4
/100
|
#167
Average
4.5%
Immigrants | Europe
54.7
/100
|
#168
Average
4.5%
Immigrants | Egypt
54.7
/100
|
#169
Average
4.5%
Spaniards
54.3
/100
|
#170
Average
4.5%