Immigrants from Uruguay vs Scandinavian Unemployment

COMPARE

Immigrants from Uruguay
Race
Ancestry
AfghanAfricanAlaska NativeAlaskan AthabascanAlbanianAleutAlsatianAmericanApacheArabArapahoArgentineanArmenianAssyrian/Chaldean/SyriacAustralianAustrianBahamianBangladeshiBarbadianBasqueBelgianBelizeanBermudanBhutaneseBlackfeetBolivianBrazilianBritishBritish West IndianBulgarianBurmeseCajunCambodianCanadianCape VerdeanCarpatho RusynCelticCentral AmericanCentral American IndianCherokeeCheyenneChickasawChileanChineseChippewaChoctawColombianColvilleComancheCosta RicanCreeCreekCroatianCrowCubanCypriotCzechCzechoslovakianDanishDelawareDominicanDutchDutch West IndianEastern EuropeanEcuadorianEgyptianEnglishEstonianEthiopianEuropeanFijianFilipinoFinnishFrenchFrench American IndianFrench CanadianGermanGerman RussianGhanaianGreekGuamanian/ChamorroGuatemalanGuyaneseHaitianHmongHonduranHopiHoumaHungarianIcelanderIndian (Asian)IndonesianInupiatIranianIraqiIrishIroquoisIsraeliItalianJamaicanJapaneseJordanianKenyanKiowaKoreanLaotianLatvianLebaneseLiberianLithuanianLumbeeLuxembourgerMacedonianMalaysianMalteseMarshalleseMenomineeMexicanMexican American IndianMongolianMoroccanNative HawaiianNavajoNepaleseNew ZealanderNicaraguanNigerianNorthern EuropeanNorwegianOkinawanOsageOttawaPaiutePakistaniPalestinianPanamanianParaguayanPennsylvania GermanPeruvianPimaPolishPortuguesePotawatomiPuebloPuerto RicanPuget Sound SalishRomanianRussianSalvadoranSamoanScotch-IrishScottishSeminoleSenegaleseSerbianShoshoneSierra LeoneanSiouxSlavicSlovakSloveneSomaliSouth AfricanSouth AmericanSouth American IndianSoviet UnionSpaniardSpanishSpanish AmericanSpanish American IndianSri LankanSubsaharan AfricanSudaneseSwedishSwissSyrianTaiwaneseThaiTlingit-HaidaTohono O'OdhamTonganTrinidadian and TobagonianTsimshianTurkishU.S. Virgin IslanderUgandanUkrainianUruguayanUteVenezuelanVietnameseWelshWest IndianYakamaYaquiYugoslavianYumanYup'ikZimbabwean
Immigration
NonimmigrantsImmigrantsAfghanistanAfricaAlbaniaArgentinaArmeniaAsiaAustraliaAustriaBahamasBangladeshBarbadosBelarusBelgiumBelizeBoliviaBosnia and HerzegovinaBrazilBulgariaBurma/MyanmarCabo VerdeCambodiaCameroonCanadaCaribbeanCentral AmericaChileChinaColombiaCongoCosta RicaCroatiaCubaCzechoslovakiaDenmarkDominicaDominican RepublicEastern AfricaEastern AsiaEastern EuropeEcuadorEgyptEl SalvadorEnglandEritreaEthiopiaEuropeFijiFranceGermanyGhanaGreeceGrenadaGuatemalaGuyanaHaitiHondurasHong KongHungaryIndiaIndonesiaIranIraqIrelandIsraelItalyJamaicaJapanJordanKazakhstanKenyaKoreaKuwaitLaosLatin AmericaLatviaLebanonLiberiaLithuaniaMalaysiaMexicoMicronesiaMiddle AfricaMoldovaMoroccoNepalNetherlandsNicaraguaNigeriaNorth AmericaNorth MacedoniaNorthern AfricaNorthern EuropeNorwayOceaniaPakistanPanamaPeruPhilippinesPolandPortugalRomaniaRussiaSaudi ArabiaScotlandSenegalSerbiaSierra LeoneSingaporeSomaliaSouth AfricaSouth AmericaSouth Central AsiaSouth Eastern AsiaSouthern EuropeSpainSri LankaSt. Vincent and the GrenadinesSudanSwedenSwitzerlandSyriaTaiwanThailandTrinidad and TobagoTurkeyUgandaUkraineUruguayUzbekistanVenezuelaVietnamWest IndiesWestern AfricaWestern AsiaWestern EuropeYemenZaireZimbabweAzores
Scandinavian
Race
Ancestry
AfghanAfricanAlaska NativeAlaskan AthabascanAlbanianAleutAlsatianAmericanApacheArabArapahoArgentineanArmenianAssyrian/Chaldean/SyriacAustralianAustrianBahamianBangladeshiBarbadianBasqueBelgianBelizeanBermudanBhutaneseBlackfeetBolivianBrazilianBritishBritish West IndianBulgarianBurmeseCajunCambodianCanadianCape VerdeanCarpatho RusynCelticCentral AmericanCentral American IndianCherokeeCheyenneChickasawChileanChineseChippewaChoctawColombianColvilleComancheCosta RicanCreeCreekCroatianCrowCubanCypriotCzechCzechoslovakianDanishDelawareDominicanDutchDutch West IndianEastern EuropeanEcuadorianEgyptianEnglishEstonianEthiopianEuropeanFijianFilipinoFinnishFrenchFrench American IndianFrench CanadianGermanGerman RussianGhanaianGreekGuamanian/ChamorroGuatemalanGuyaneseHaitianHmongHonduranHopiHoumaHungarianIcelanderIndian (Asian)IndonesianInupiatIranianIraqiIrishIroquoisIsraeliItalianJamaicanJapaneseJordanianKenyanKiowaKoreanLaotianLatvianLebaneseLiberianLithuanianLumbeeLuxembourgerMacedonianMalaysianMalteseMarshalleseMenomineeMexicanMexican American IndianMongolianMoroccanNative HawaiianNavajoNepaleseNew ZealanderNicaraguanNigerianNorthern EuropeanNorwegianOkinawanOsageOttawaPaiutePakistaniPalestinianPanamanianParaguayanPennsylvania GermanPeruvianPimaPolishPortuguesePotawatomiPuebloPuerto RicanPuget Sound SalishRomanianRussianSalvadoranSamoanScandinavianScotch-IrishScottishSeminoleSenegaleseSerbianShoshoneSierra LeoneanSiouxSlavicSlovakSloveneSomaliSouth AfricanSouth AmericanSouth American IndianSoviet UnionSpaniardSpanishSpanish AmericanSpanish American IndianSri LankanSubsaharan AfricanSudaneseSwedishSwissSyrianTaiwaneseThaiTlingit-HaidaTohono O'OdhamTonganTrinidadian and TobagonianTsimshianTurkishU.S. Virgin IslanderUgandanUkrainianUruguayanUteVenezuelanVietnameseWelshWest IndianYakamaYaquiYugoslavianYumanYup'ikZimbabwean
Immigration
NonimmigrantsImmigrantsAfghanistanAfricaAlbaniaArgentinaArmeniaAsiaAustraliaAustriaBahamasBangladeshBarbadosBelarusBelgiumBelizeBoliviaBosnia and HerzegovinaBrazilBulgariaBurma/MyanmarCabo VerdeCambodiaCameroonCanadaCaribbeanCentral AmericaChileChinaColombiaCongoCosta RicaCroatiaCubaCzechoslovakiaDenmarkDominicaDominican RepublicEastern AfricaEastern AsiaEastern EuropeEcuadorEgyptEl SalvadorEnglandEritreaEthiopiaEuropeFijiFranceGermanyGhanaGreeceGrenadaGuatemalaGuyanaHaitiHondurasHong KongHungaryIndiaIndonesiaIranIraqIrelandIsraelItalyJamaicaJapanJordanKazakhstanKenyaKoreaKuwaitLaosLatin AmericaLatviaLebanonLiberiaLithuaniaMalaysiaMexicoMicronesiaMiddle AfricaMoldovaMoroccoNepalNetherlandsNicaraguaNigeriaNorth AmericaNorth MacedoniaNorthern AfricaNorthern EuropeNorwayOceaniaPakistanPanamaPeruPhilippinesPolandPortugalRomaniaRussiaSaudi ArabiaScotlandSenegalSerbiaSierra LeoneSingaporeSomaliaSouth AfricaSouth AmericaSouth Central AsiaSouth Eastern AsiaSouthern EuropeSpainSri LankaSt. Vincent and the GrenadinesSudanSwedenSwitzerlandSyriaTaiwanThailandTrinidad and TobagoTurkeyUgandaUkraineUzbekistanVenezuelaVietnamWest IndiesWestern AfricaWestern AsiaWestern EuropeYemenZaireZimbabweAzores
Unemployment
Income
Poverty
Unemployment
Labor Participation
Family Structure
Vehicle Availability
Education Level
Disability

Unemployment Comparison

Immigrants from Uruguay

Scandinavians

Fair
Exceptional
5.3%
UNEMPLOYMENT
29.8/ 100
METRIC RATING
197th/ 347
METRIC RANK
4.5%
UNEMPLOYMENT
100.0/ 100
METRIC RATING
9th/ 347
METRIC RANK

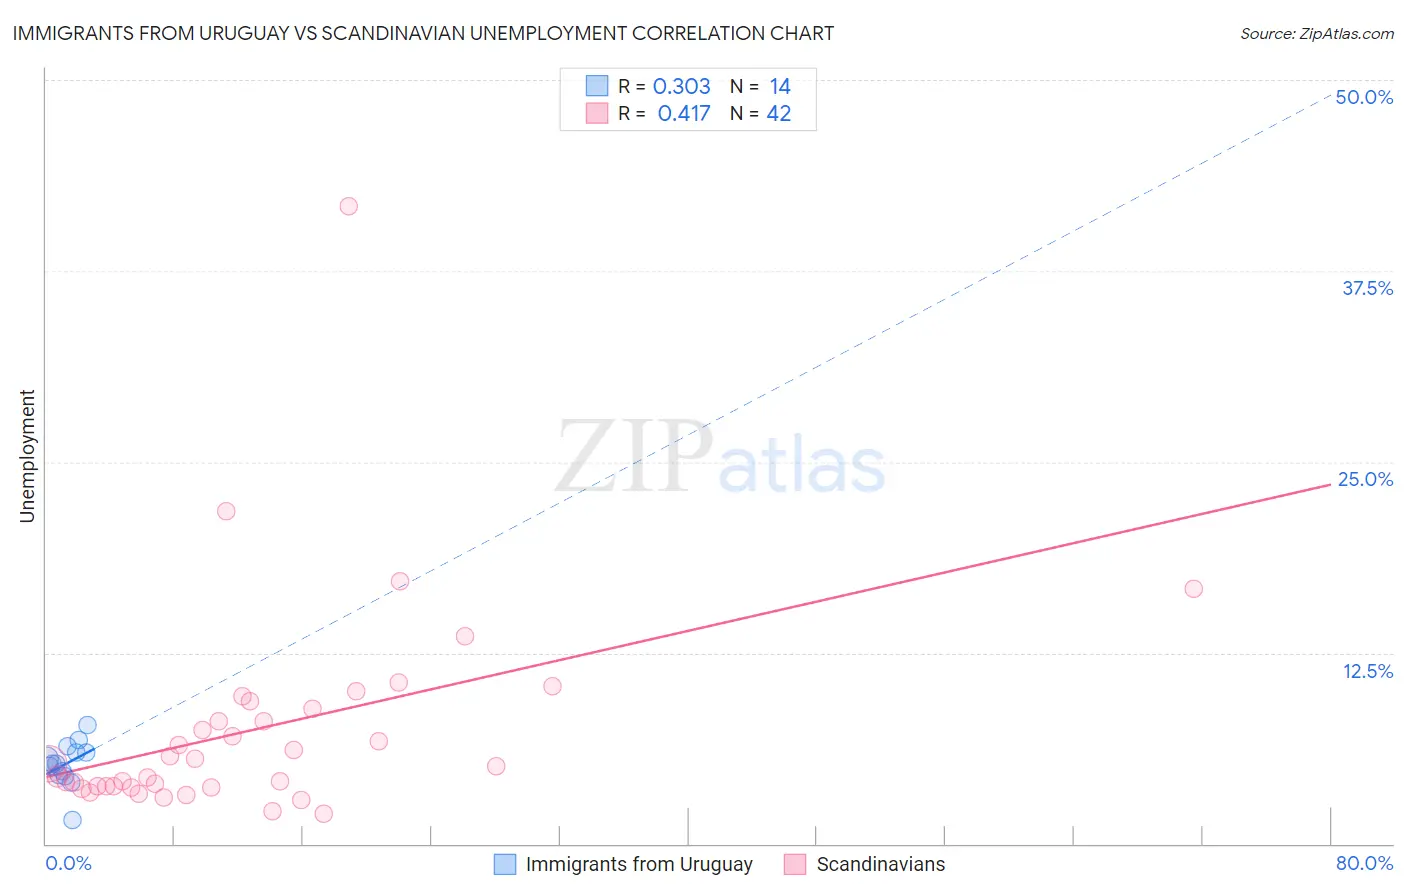
Immigrants from Uruguay vs Scandinavian Unemployment Correlation Chart

The statistical analysis conducted on geographies consisting of 133,243,021 people shows a mild positive correlation between the proportion of Immigrants from Uruguay and unemployment in the United States with a correlation coefficient (R) of 0.303 and weighted average of 5.3%. Similarly, the statistical analysis conducted on geographies consisting of 471,134,185 people shows a moderate positive correlation between the proportion of Scandinavians and unemployment in the United States with a correlation coefficient (R) of 0.417 and weighted average of 4.5%, a difference of 17.2%.
Immigrants from Uruguay vs Scandinavian Unemployment

Unemployment Correlation Summary

MeasurementImmigrants from UruguayScandinavian
Minimum1.6%2.0%
Maximum7.8%41.7%
Range6.2%39.7%
Mean5.2%7.4%
Median5.3%5.2%
Interquartile 25% (IQ1)4.5%3.7%
Interquartile 75% (IQ3)6.0%8.8%
Interquartile Range (IQR)1.5%5.1%
Standard Deviation (Sample)1.5%6.9%
Standard Deviation (Population)1.4%6.8%

Similar Demographics by Unemployment

Demographics Similar to Immigrants from Uruguay by Unemployment

In terms of unemployment, the demographic groups most similar to Immigrants from Uruguay are Peruvian (5.3%, a difference of 0.010%), Immigrants from Laos (5.3%, a difference of 0.080%), Immigrants from Southern Europe (5.3%, a difference of 0.080%), Immigrants from Israel (5.3%, a difference of 0.090%), and Immigrants from Afghanistan (5.3%, a difference of 0.090%).
DemographicsRating | RankUnemployment
Arabs
35.3
/100
|
#190
Fair
5.3%
Somalis
34.0
/100
|
#191
Fair
5.3%
South Americans
33.9
/100
|
#192
Fair
5.3%
Immigrants | Somalia
33.8
/100
|
#193
Fair
5.3%
Immigrants | Laos
30.9
/100
|
#194
Fair
5.3%
Immigrants | Southern Europe
30.9
/100
|
#195
Fair
5.3%
Peruvians
29.9
/100
|
#196
Fair
5.3%
Immigrants | Uruguay
29.8
/100
|
#197
Fair
5.3%
Immigrants | Israel
28.6
/100
|
#198
Fair
5.3%
Immigrants | Afghanistan
28.6
/100
|
#199
Fair
5.3%
Koreans
27.4
/100
|
#200
Fair
5.3%
Immigrants | South Eastern Asia
27.0
/100
|
#201
Fair
5.3%
Cherokee
25.5
/100
|
#202
Fair
5.3%
Immigrants | Micronesia
25.2
/100
|
#203
Fair
5.3%
Immigrants | Ukraine
24.9
/100
|
#204
Fair
5.3%

Demographics Similar to Scandinavians by Unemployment

In terms of unemployment, the demographic groups most similar to Scandinavians are Swiss (4.5%, a difference of 0.39%), Dutch (4.6%, a difference of 0.51%), Immigrants from India (4.5%, a difference of 0.86%), English (4.6%, a difference of 1.2%), and Pennsylvania German (4.6%, a difference of 1.3%).
DemographicsRating | RankUnemployment
Luxembourgers
100.0
/100
|
#2
Exceptional
4.3%
Czechs
100.0
/100
|
#3
Exceptional
4.3%
Danes
100.0
/100
|
#4
Exceptional
4.3%
Swedes
100.0
/100
|
#5
Exceptional
4.4%
Germans
100.0
/100
|
#6
Exceptional
4.5%
Immigrants | India
100.0
/100
|
#7
Exceptional
4.5%
Swiss
100.0
/100
|
#8
Exceptional
4.5%
Scandinavians
100.0
/100
|
#9
Exceptional
4.5%
Dutch
100.0
/100
|
#10
Exceptional
4.6%
English
100.0
/100
|
#11
Exceptional
4.6%
Pennsylvania Germans
100.0
/100
|
#12
Exceptional
4.6%
Belgians
100.0
/100
|
#13
Exceptional
4.6%
Immigrants | Cuba
100.0
/100
|
#14
Exceptional
4.6%
Europeans
99.9
/100
|
#15
Exceptional
4.6%
Chinese
99.9
/100
|
#16
Exceptional
4.7%