French vs Scandinavian Unemployment
COMPARE
French
Scandinavian
Unemployment
Unemployment Comparison
French
Scandinavians
4.8%
UNEMPLOYMENT
99.5/ 100
METRIC RATING
45th/ 347
METRIC RANK
4.5%
UNEMPLOYMENT
100.0/ 100
METRIC RATING
9th/ 347
METRIC RANK
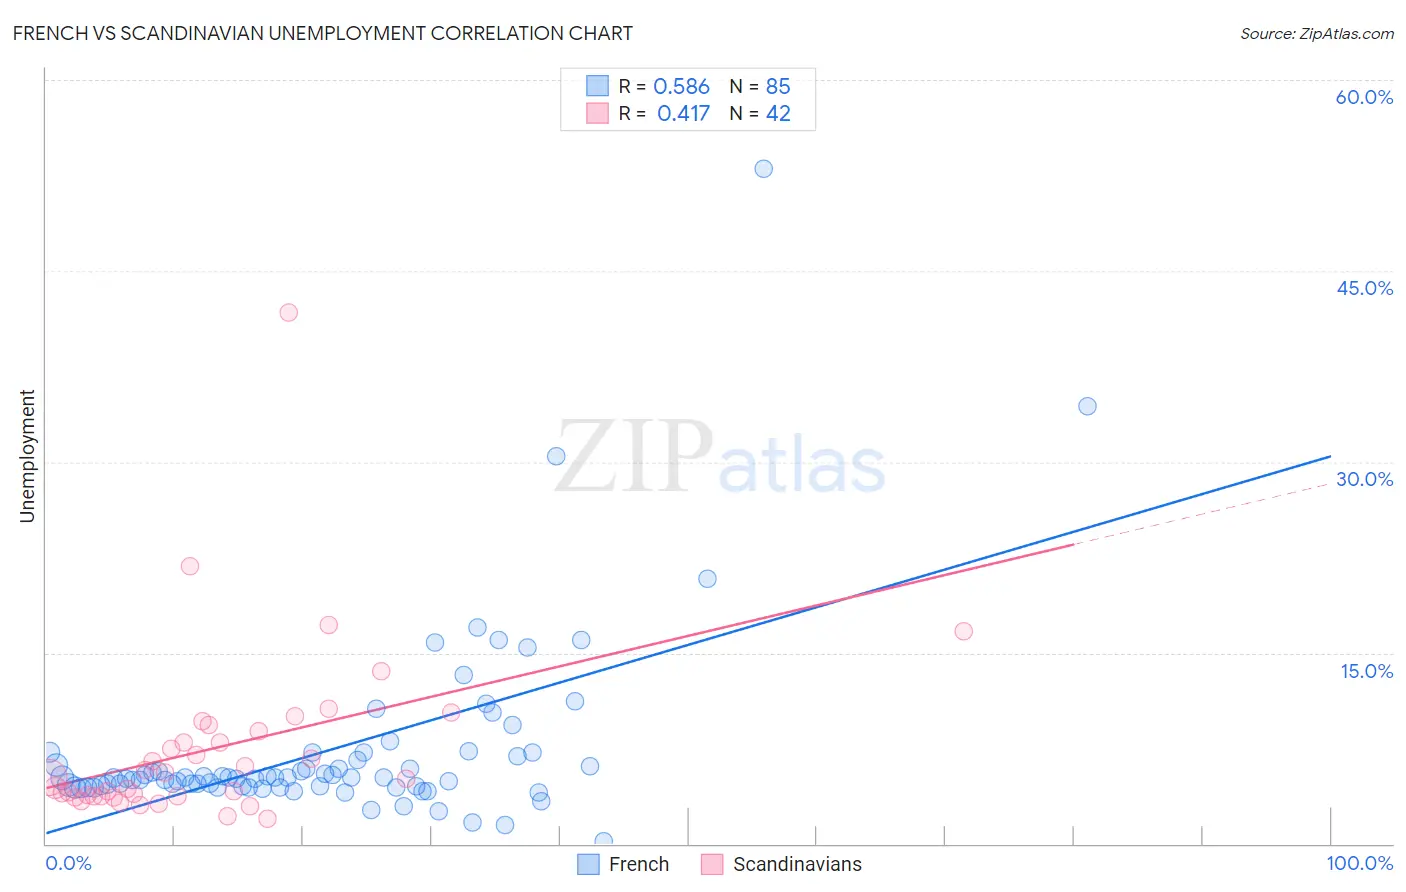
French vs Scandinavian Unemployment Correlation Chart
The statistical analysis conducted on geographies consisting of 568,292,844 people shows a substantial positive correlation between the proportion of French and unemployment in the United States with a correlation coefficient (R) of 0.586 and weighted average of 4.8%. Similarly, the statistical analysis conducted on geographies consisting of 471,134,185 people shows a moderate positive correlation between the proportion of Scandinavians and unemployment in the United States with a correlation coefficient (R) of 0.417 and weighted average of 4.5%, a difference of 6.4%.
Unemployment Correlation Summary
| Measurement | French | Scandinavian |
| Minimum | 0.20% | 2.0% |
| Maximum | 53.0% | 41.7% |
| Range | 52.8% | 39.7% |
| Mean | 7.4% | 7.4% |
| Median | 5.2% | 5.2% |
| Interquartile 25% (IQ1) | 4.5% | 3.7% |
| Interquartile 75% (IQ3) | 7.0% | 8.8% |
| Interquartile Range (IQR) | 2.5% | 5.1% |
| Standard Deviation (Sample) | 7.3% | 6.9% |
| Standard Deviation (Population) | 7.3% | 6.8% |
Similar Demographics by Unemployment
Demographics Similar to French by Unemployment
In terms of unemployment, the demographic groups most similar to French are Austrian (4.8%, a difference of 0.050%), Yugoslavian (4.8%, a difference of 0.11%), Immigrants from Nepal (4.8%, a difference of 0.16%), Immigrants from Taiwan (4.8%, a difference of 0.18%), and Filipino (4.8%, a difference of 0.31%).
| Demographics | Rating | Rank | Unemployment |
| Bolivians | 99.7 /100 | #38 | Exceptional 4.8% |
| Lithuanians | 99.7 /100 | #39 | Exceptional 4.8% |
| Northern Europeans | 99.7 /100 | #40 | Exceptional 4.8% |
| Immigrants | Bosnia and Herzegovina | 99.7 /100 | #41 | Exceptional 4.8% |
| Filipinos | 99.5 /100 | #42 | Exceptional 4.8% |
| Yugoslavians | 99.5 /100 | #43 | Exceptional 4.8% |
| Austrians | 99.5 /100 | #44 | Exceptional 4.8% |
| French | 99.5 /100 | #45 | Exceptional 4.8% |
| Immigrants | Nepal | 99.4 /100 | #46 | Exceptional 4.8% |
| Immigrants | Taiwan | 99.4 /100 | #47 | Exceptional 4.8% |
| Immigrants | Scotland | 99.3 /100 | #48 | Exceptional 4.9% |
| Immigrants | South Central Asia | 99.3 /100 | #49 | Exceptional 4.9% |
| French Canadians | 99.3 /100 | #50 | Exceptional 4.9% |
| Immigrants | Belgium | 99.2 /100 | #51 | Exceptional 4.9% |
| Whites/Caucasians | 99.2 /100 | #52 | Exceptional 4.9% |
Demographics Similar to Scandinavians by Unemployment
In terms of unemployment, the demographic groups most similar to Scandinavians are Swiss (4.5%, a difference of 0.39%), Dutch (4.6%, a difference of 0.51%), Immigrants from India (4.5%, a difference of 0.86%), English (4.6%, a difference of 1.2%), and Pennsylvania German (4.6%, a difference of 1.3%).
| Demographics | Rating | Rank | Unemployment |
| Luxembourgers | 100.0 /100 | #2 | Exceptional 4.3% |
| Czechs | 100.0 /100 | #3 | Exceptional 4.3% |
| Danes | 100.0 /100 | #4 | Exceptional 4.3% |
| Swedes | 100.0 /100 | #5 | Exceptional 4.4% |
| Germans | 100.0 /100 | #6 | Exceptional 4.5% |
| Immigrants | India | 100.0 /100 | #7 | Exceptional 4.5% |
| Swiss | 100.0 /100 | #8 | Exceptional 4.5% |
| Scandinavians | 100.0 /100 | #9 | Exceptional 4.5% |
| Dutch | 100.0 /100 | #10 | Exceptional 4.6% |
| English | 100.0 /100 | #11 | Exceptional 4.6% |
| Pennsylvania Germans | 100.0 /100 | #12 | Exceptional 4.6% |
| Belgians | 100.0 /100 | #13 | Exceptional 4.6% |
| Immigrants | Cuba | 100.0 /100 | #14 | Exceptional 4.6% |
| Europeans | 99.9 /100 | #15 | Exceptional 4.6% |
| Chinese | 99.9 /100 | #16 | Exceptional 4.7% |