Immigrants from Uruguay vs French American Indian Unemployment Among Ages 55 to 59 years

COMPARE

Immigrants from Uruguay
Race
Ancestry
AfghanAfricanAlaska NativeAlaskan AthabascanAlbanianAleutAlsatianAmericanApacheArabArapahoArgentineanArmenianAssyrian/Chaldean/SyriacAustralianAustrianBahamianBangladeshiBarbadianBasqueBelgianBelizeanBermudanBhutaneseBlackfeetBolivianBrazilianBritishBritish West IndianBulgarianBurmeseCajunCambodianCanadianCape VerdeanCarpatho RusynCelticCentral AmericanCentral American IndianCherokeeCheyenneChickasawChileanChineseChippewaChoctawColombianColvilleComancheCosta RicanCreeCreekCroatianCrowCubanCypriotCzechCzechoslovakianDanishDelawareDominicanDutchDutch West IndianEastern EuropeanEcuadorianEgyptianEnglishEstonianEthiopianEuropeanFijianFilipinoFinnishFrenchFrench CanadianGermanGerman RussianGhanaianGreekGuamanian/ChamorroGuatemalanGuyaneseHaitianHmongHonduranHopiHoumaHungarianIcelanderIndian (Asian)IndonesianInupiatIranianIraqiIrishIroquoisIsraeliItalianJamaicanJapaneseJordanianKenyanKiowaKoreanLaotianLatvianLebaneseLiberianLithuanianLumbeeLuxembourgerMacedonianMalaysianMalteseMarshalleseMenomineeMexicanMexican American IndianMongolianMoroccanNative HawaiianNavajoNepaleseNew ZealanderNicaraguanNigerianNorthern EuropeanNorwegianOkinawanOsageOttawaPaiutePakistaniPalestinianPanamanianParaguayanPennsylvania GermanPeruvianPimaPolishPortuguesePotawatomiPuebloPuerto RicanPuget Sound SalishRomanianRussianSalvadoranSamoanScandinavianScotch-IrishScottishSeminoleSenegaleseSerbianShoshoneSierra LeoneanSiouxSlavicSlovakSloveneSomaliSouth AfricanSouth AmericanSouth American IndianSoviet UnionSpaniardSpanishSpanish AmericanSpanish American IndianSri LankanSubsaharan AfricanSudaneseSwedishSwissSyrianTaiwaneseThaiTlingit-HaidaTohono O'OdhamTonganTrinidadian and TobagonianTsimshianTurkishU.S. Virgin IslanderUgandanUkrainianUruguayanUteVenezuelanVietnameseWelshWest IndianYakamaYaquiYugoslavianYumanYup'ikZimbabwean
Immigration
NonimmigrantsImmigrantsAfghanistanAfricaAlbaniaArgentinaArmeniaAsiaAustraliaAustriaBahamasBangladeshBarbadosBelarusBelgiumBelizeBoliviaBosnia and HerzegovinaBrazilBulgariaBurma/MyanmarCabo VerdeCambodiaCameroonCanadaCaribbeanCentral AmericaChileChinaColombiaCongoCosta RicaCroatiaCubaCzechoslovakiaDenmarkDominicaDominican RepublicEastern AfricaEastern AsiaEastern EuropeEcuadorEgyptEl SalvadorEnglandEritreaEthiopiaEuropeFijiFranceGermanyGhanaGreeceGrenadaGuatemalaGuyanaHaitiHondurasHong KongHungaryIndiaIndonesiaIranIraqIrelandIsraelItalyJamaicaJapanJordanKazakhstanKenyaKoreaKuwaitLaosLatin AmericaLatviaLebanonLiberiaLithuaniaMalaysiaMexicoMicronesiaMiddle AfricaMoldovaMoroccoNepalNetherlandsNicaraguaNigeriaNorth AmericaNorth MacedoniaNorthern AfricaNorthern EuropeNorwayOceaniaPakistanPanamaPeruPhilippinesPolandPortugalRomaniaRussiaSaudi ArabiaScotlandSenegalSerbiaSierra LeoneSingaporeSomaliaSouth AfricaSouth AmericaSouth Central AsiaSouth Eastern AsiaSouthern EuropeSpainSri LankaSt. Vincent and the GrenadinesSudanSwedenSwitzerlandSyriaTaiwanThailandTrinidad and TobagoTurkeyUgandaUkraineUruguayUzbekistanVenezuelaVietnamWest IndiesWestern AfricaWestern AsiaWestern EuropeYemenZaireZimbabweAzores
French American Indian
Race
Ancestry
AfghanAfricanAlaska NativeAlaskan AthabascanAlbanianAleutAlsatianAmericanApacheArabArapahoArgentineanArmenianAssyrian/Chaldean/SyriacAustralianAustrianBahamianBangladeshiBarbadianBasqueBelgianBelizeanBermudanBhutaneseBlackfeetBolivianBrazilianBritishBritish West IndianBulgarianBurmeseCajunCambodianCanadianCape VerdeanCarpatho RusynCelticCentral AmericanCentral American IndianCherokeeCheyenneChickasawChileanChineseChippewaChoctawColombianColvilleComancheCosta RicanCreeCreekCroatianCrowCubanCypriotCzechCzechoslovakianDanishDelawareDominicanDutchDutch West IndianEastern EuropeanEcuadorianEgyptianEnglishEstonianEthiopianEuropeanFijianFilipinoFinnishFrenchFrench American IndianFrench CanadianGermanGerman RussianGhanaianGreekGuamanian/ChamorroGuatemalanGuyaneseHaitianHmongHonduranHopiHoumaHungarianIcelanderIndian (Asian)IndonesianInupiatIranianIraqiIrishIroquoisIsraeliItalianJamaicanJapaneseJordanianKenyanKiowaKoreanLaotianLatvianLebaneseLiberianLithuanianLumbeeLuxembourgerMacedonianMalaysianMalteseMarshalleseMenomineeMexicanMexican American IndianMongolianMoroccanNative HawaiianNavajoNepaleseNew ZealanderNicaraguanNigerianNorthern EuropeanNorwegianOkinawanOsageOttawaPaiutePakistaniPalestinianPanamanianParaguayanPennsylvania GermanPeruvianPimaPolishPortuguesePotawatomiPuebloPuerto RicanPuget Sound SalishRomanianRussianSalvadoranSamoanScandinavianScotch-IrishScottishSeminoleSenegaleseSerbianShoshoneSierra LeoneanSiouxSlavicSlovakSloveneSomaliSouth AfricanSouth AmericanSouth American IndianSoviet UnionSpaniardSpanishSpanish AmericanSpanish American IndianSri LankanSubsaharan AfricanSudaneseSwedishSwissSyrianTaiwaneseThaiTlingit-HaidaTohono O'OdhamTonganTrinidadian and TobagonianTsimshianTurkishU.S. Virgin IslanderUgandanUkrainianUruguayanUteVenezuelanVietnameseWelshWest IndianYakamaYaquiYugoslavianYumanYup'ikZimbabwean
Immigration
NonimmigrantsImmigrantsAfghanistanAfricaAlbaniaArgentinaArmeniaAsiaAustraliaAustriaBahamasBangladeshBarbadosBelarusBelgiumBelizeBoliviaBosnia and HerzegovinaBrazilBulgariaBurma/MyanmarCabo VerdeCambodiaCameroonCanadaCaribbeanCentral AmericaChileChinaColombiaCongoCosta RicaCroatiaCubaCzechoslovakiaDenmarkDominicaDominican RepublicEastern AfricaEastern AsiaEastern EuropeEcuadorEgyptEl SalvadorEnglandEritreaEthiopiaEuropeFijiFranceGermanyGhanaGreeceGrenadaGuatemalaGuyanaHaitiHondurasHong KongHungaryIndiaIndonesiaIranIraqIrelandIsraelItalyJamaicaJapanJordanKazakhstanKenyaKoreaKuwaitLaosLatin AmericaLatviaLebanonLiberiaLithuaniaMalaysiaMexicoMicronesiaMiddle AfricaMoldovaMoroccoNepalNetherlandsNicaraguaNigeriaNorth AmericaNorth MacedoniaNorthern AfricaNorthern EuropeNorwayOceaniaPakistanPanamaPeruPhilippinesPolandPortugalRomaniaRussiaSaudi ArabiaScotlandSenegalSerbiaSierra LeoneSingaporeSomaliaSouth AfricaSouth AmericaSouth Central AsiaSouth Eastern AsiaSouthern EuropeSpainSri LankaSt. Vincent and the GrenadinesSudanSwedenSwitzerlandSyriaTaiwanThailandTrinidad and TobagoTurkeyUgandaUkraineUzbekistanVenezuelaVietnamWest IndiesWestern AfricaWestern AsiaWestern EuropeYemenZaireZimbabweAzores
Unemployment Among Ages 55 to 59 years
Income
Poverty
Unemployment
Labor Participation
Family Structure
Vehicle Availability
Education Level
Disability

Unemployment Among Ages 55 to 59 years Comparison

Immigrants from Uruguay

French American Indians

Good
Tragic
4.8%
UNEMPLOYMENT AMONG AGES 55 TO 59 YEARS
67.2/ 100
METRIC RATING
153rd/ 347
METRIC RANK
5.0%
UNEMPLOYMENT AMONG AGES 55 TO 59 YEARS
1.2/ 100
METRIC RATING
239th/ 347
METRIC RANK

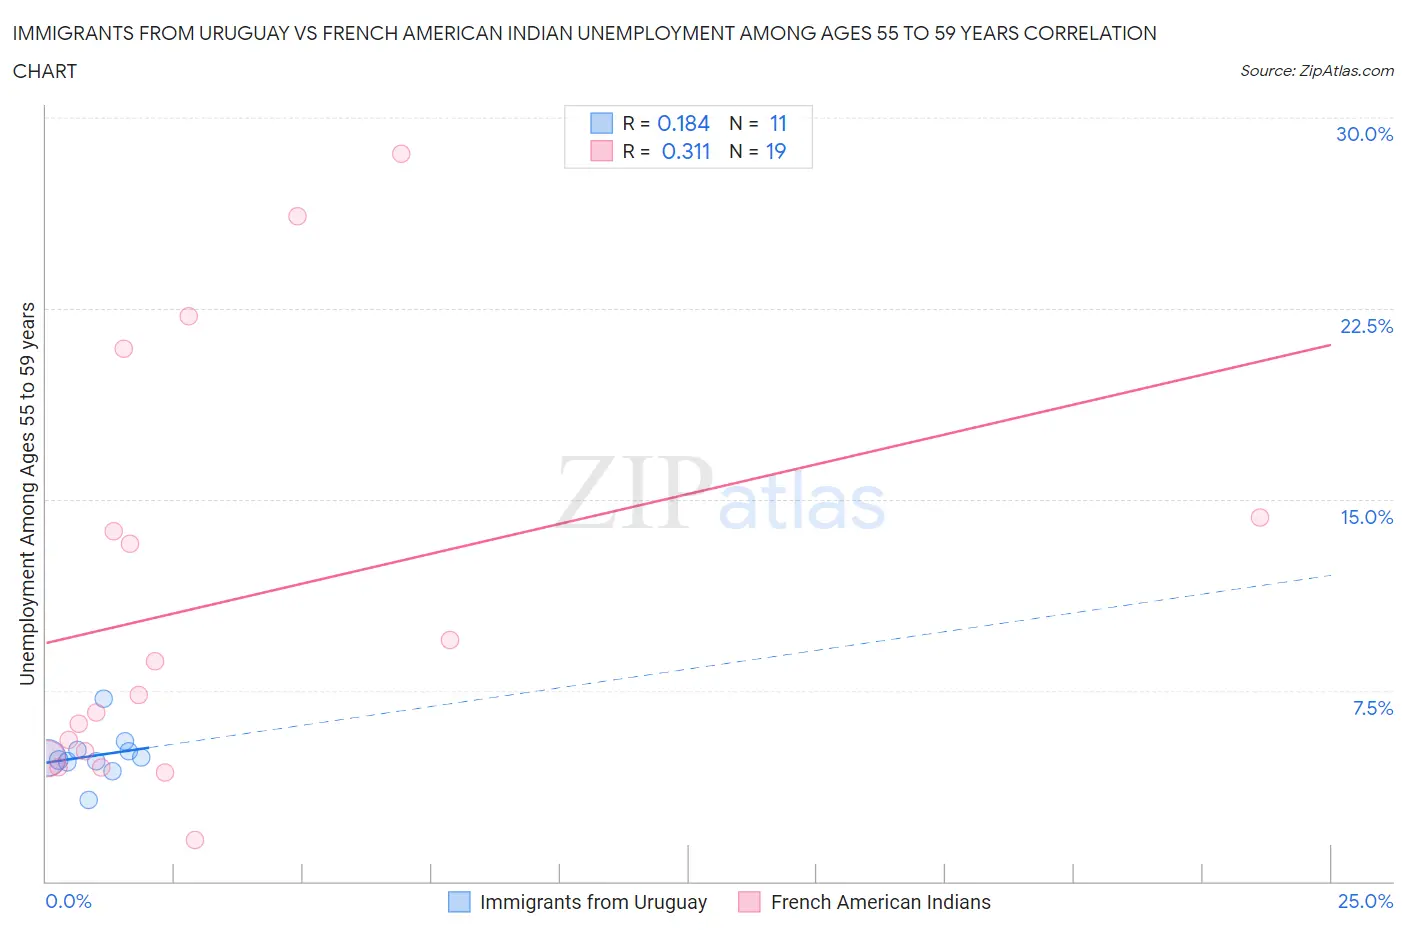
Immigrants from Uruguay vs French American Indian Unemployment Among Ages 55 to 59 years Correlation Chart

The statistical analysis conducted on geographies consisting of 129,949,606 people shows a poor positive correlation between the proportion of Immigrants from Uruguay and unemployment rate among population between the ages 55 and 59 in the United States with a correlation coefficient (R) of 0.184 and weighted average of 4.8%. Similarly, the statistical analysis conducted on geographies consisting of 126,742,970 people shows a mild positive correlation between the proportion of French American Indians and unemployment rate among population between the ages 55 and 59 in the United States with a correlation coefficient (R) of 0.311 and weighted average of 5.0%, a difference of 5.2%.
Immigrants from Uruguay vs French American Indian Unemployment Among Ages 55 to 59 years

Unemployment Among Ages 55 to 59 years Correlation Summary

MeasurementImmigrants from UruguayFrench American Indian
Minimum3.2%1.6%
Maximum7.2%28.6%
Range4.0%27.0%
Mean4.9%10.9%
Median4.9%7.3%
Interquartile 25% (IQ1)4.7%4.8%
Interquartile 75% (IQ3)5.2%14.3%
Interquartile Range (IQR)0.47%9.5%
Standard Deviation (Sample)0.94%8.1%
Standard Deviation (Population)0.90%7.8%

Similar Demographics by Unemployment Among Ages 55 to 59 years

Demographics Similar to Immigrants from Uruguay by Unemployment Among Ages 55 to 59 years

In terms of unemployment among ages 55 to 59 years, the demographic groups most similar to Immigrants from Uruguay are Immigrants from Panama (4.8%, a difference of 0.020%), Immigrants from North Macedonia (4.8%, a difference of 0.040%), Laotian (4.8%, a difference of 0.050%), Italian (4.8%, a difference of 0.050%), and Bahamian (4.8%, a difference of 0.060%).
DemographicsRating | RankUnemployment Among Ages 55 to 59 years
Immigrants | South Eastern Asia
77.4
/100
|
#146
Good
4.8%
Immigrants | Singapore
76.6
/100
|
#147
Good
4.8%
Immigrants | Bahamas
71.8
/100
|
#148
Good
4.8%
Immigrants | Lithuania
70.8
/100
|
#149
Good
4.8%
Immigrants | Northern Africa
69.8
/100
|
#150
Good
4.8%
Bahamians
68.6
/100
|
#151
Good
4.8%
Laotians
68.2
/100
|
#152
Good
4.8%
Immigrants | Uruguay
67.2
/100
|
#153
Good
4.8%
Immigrants | Panama
66.8
/100
|
#154
Good
4.8%
Immigrants | North Macedonia
66.3
/100
|
#155
Good
4.8%
Italians
66.2
/100
|
#156
Good
4.8%
Carpatho Rusyns
66.0
/100
|
#157
Good
4.8%
Slovaks
65.3
/100
|
#158
Good
4.8%
Immigrants | Nicaragua
65.2
/100
|
#159
Good
4.8%
Chickasaw
65.1
/100
|
#160
Good
4.8%

Demographics Similar to French American Indians by Unemployment Among Ages 55 to 59 years

In terms of unemployment among ages 55 to 59 years, the demographic groups most similar to French American Indians are Moroccan (5.0%, a difference of 0.010%), Immigrants from Albania (5.0%, a difference of 0.040%), Choctaw (5.0%, a difference of 0.040%), Immigrants from Costa Rica (5.0%, a difference of 0.13%), and Immigrants from Hong Kong (5.0%, a difference of 0.15%).
DemographicsRating | RankUnemployment Among Ages 55 to 59 years
Albanians
2.5
/100
|
#232
Tragic
5.0%
Immigrants | Immigrants
2.3
/100
|
#233
Tragic
5.0%
Immigrants | Southern Europe
1.8
/100
|
#234
Tragic
5.0%
Immigrants | Hong Kong
1.4
/100
|
#235
Tragic
5.0%
Immigrants | Albania
1.3
/100
|
#236
Tragic
5.0%
Choctaw
1.3
/100
|
#237
Tragic
5.0%
Moroccans
1.3
/100
|
#238
Tragic
5.0%
French American Indians
1.2
/100
|
#239
Tragic
5.0%
Immigrants | Costa Rica
1.1
/100
|
#240
Tragic
5.0%
Brazilians
1.0
/100
|
#241
Tragic
5.0%
Liberians
0.9
/100
|
#242
Tragic
5.1%
Hondurans
0.7
/100
|
#243
Tragic
5.1%
Immigrants | Fiji
0.7
/100
|
#244
Tragic
5.1%
Soviet Union
0.6
/100
|
#245
Tragic
5.1%
Immigrants | Greece
0.6
/100
|
#246
Tragic
5.1%