Immigrants from Sri Lanka vs Central American Unemployment Among Seniors over 65 years

COMPARE

Immigrants from Sri Lanka
Race
Ancestry
AfghanAfricanAlaska NativeAlaskan AthabascanAlbanianAleutAlsatianAmericanApacheArabArapahoArgentineanArmenianAssyrian/Chaldean/SyriacAustralianAustrianBahamianBangladeshiBarbadianBasqueBelgianBelizeanBermudanBhutaneseBlackfeetBolivianBrazilianBritishBritish West IndianBulgarianBurmeseCajunCambodianCanadianCape VerdeanCarpatho RusynCelticCentral American IndianCherokeeCheyenneChickasawChileanChineseChippewaChoctawColombianColvilleComancheCosta RicanCreeCreekCroatianCrowCubanCypriotCzechCzechoslovakianDanishDelawareDominicanDutchDutch West IndianEastern EuropeanEcuadorianEgyptianEnglishEstonianEthiopianEuropeanFijianFilipinoFinnishFrenchFrench American IndianFrench CanadianGermanGerman RussianGhanaianGreekGuamanian/ChamorroGuatemalanGuyaneseHaitianHmongHonduranHopiHoumaHungarianIcelanderIndian (Asian)IndonesianInupiatIranianIraqiIrishIroquoisIsraeliItalianJamaicanJapaneseJordanianKenyanKiowaKoreanLaotianLatvianLebaneseLiberianLithuanianLumbeeLuxembourgerMacedonianMalaysianMalteseMarshalleseMenomineeMexicanMexican American IndianMongolianMoroccanNative HawaiianNavajoNepaleseNew ZealanderNicaraguanNigerianNorthern EuropeanNorwegianOkinawanOsageOttawaPaiutePakistaniPalestinianPanamanianParaguayanPennsylvania GermanPeruvianPimaPolishPortuguesePotawatomiPuebloPuerto RicanPuget Sound SalishRomanianRussianSalvadoranSamoanScandinavianScotch-IrishScottishSeminoleSenegaleseSerbianShoshoneSierra LeoneanSiouxSlavicSlovakSloveneSomaliSouth AfricanSouth AmericanSouth American IndianSoviet UnionSpaniardSpanishSpanish AmericanSpanish American IndianSri LankanSubsaharan AfricanSudaneseSwedishSwissSyrianTaiwaneseThaiTlingit-HaidaTohono O'OdhamTonganTrinidadian and TobagonianTsimshianTurkishU.S. Virgin IslanderUgandanUkrainianUruguayanUteVenezuelanVietnameseWelshWest IndianYakamaYaquiYugoslavianYumanYup'ikZimbabwean
Immigration
NonimmigrantsImmigrantsAfghanistanAfricaAlbaniaArgentinaArmeniaAsiaAustraliaAustriaBahamasBangladeshBarbadosBelarusBelgiumBelizeBoliviaBosnia and HerzegovinaBrazilBulgariaBurma/MyanmarCabo VerdeCambodiaCameroonCanadaCaribbeanCentral AmericaChileChinaColombiaCongoCosta RicaCroatiaCubaCzechoslovakiaDenmarkDominicaDominican RepublicEastern AfricaEastern AsiaEastern EuropeEcuadorEgyptEl SalvadorEnglandEritreaEthiopiaEuropeFijiFranceGermanyGhanaGreeceGrenadaGuatemalaGuyanaHaitiHondurasHong KongHungaryIndiaIndonesiaIranIraqIrelandIsraelItalyJamaicaJapanJordanKazakhstanKenyaKoreaKuwaitLaosLatin AmericaLatviaLebanonLiberiaLithuaniaMalaysiaMexicoMicronesiaMiddle AfricaMoldovaMoroccoNepalNetherlandsNicaraguaNigeriaNorth AmericaNorth MacedoniaNorthern AfricaNorthern EuropeNorwayOceaniaPakistanPanamaPeruPhilippinesPolandPortugalRomaniaRussiaSaudi ArabiaScotlandSenegalSerbiaSierra LeoneSingaporeSomaliaSouth AfricaSouth AmericaSouth Central AsiaSouth Eastern AsiaSouthern EuropeSpainSri LankaSt. Vincent and the GrenadinesSudanSwedenSwitzerlandSyriaTaiwanThailandTrinidad and TobagoTurkeyUgandaUkraineUruguayUzbekistanVenezuelaVietnamWest IndiesWestern AfricaWestern AsiaWestern EuropeYemenZaireZimbabweAzores
Central American
Race
Ancestry
AfghanAfricanAlaska NativeAlaskan AthabascanAlbanianAleutAlsatianAmericanApacheArabArapahoArgentineanArmenianAssyrian/Chaldean/SyriacAustralianAustrianBahamianBangladeshiBarbadianBasqueBelgianBelizeanBermudanBhutaneseBlackfeetBolivianBrazilianBritishBritish West IndianBulgarianBurmeseCajunCambodianCanadianCape VerdeanCarpatho RusynCelticCentral AmericanCentral American IndianCherokeeCheyenneChickasawChileanChineseChippewaChoctawColombianColvilleComancheCosta RicanCreeCreekCroatianCrowCubanCypriotCzechCzechoslovakianDanishDelawareDominicanDutchDutch West IndianEastern EuropeanEcuadorianEgyptianEnglishEstonianEthiopianEuropeanFijianFilipinoFinnishFrenchFrench American IndianFrench CanadianGermanGerman RussianGhanaianGreekGuamanian/ChamorroGuatemalanGuyaneseHaitianHmongHonduranHopiHoumaHungarianIcelanderIndian (Asian)IndonesianInupiatIranianIraqiIrishIroquoisIsraeliItalianJamaicanJapaneseJordanianKenyanKiowaKoreanLaotianLatvianLebaneseLiberianLithuanianLumbeeLuxembourgerMacedonianMalaysianMalteseMarshalleseMenomineeMexicanMexican American IndianMongolianMoroccanNative HawaiianNavajoNepaleseNew ZealanderNicaraguanNigerianNorthern EuropeanNorwegianOkinawanOsageOttawaPaiutePakistaniPalestinianPanamanianParaguayanPennsylvania GermanPeruvianPimaPolishPortuguesePotawatomiPuebloPuerto RicanPuget Sound SalishRomanianRussianSalvadoranSamoanScandinavianScotch-IrishScottishSeminoleSenegaleseSerbianShoshoneSierra LeoneanSiouxSlavicSlovakSloveneSomaliSouth AfricanSouth AmericanSouth American IndianSoviet UnionSpaniardSpanishSpanish AmericanSpanish American IndianSri LankanSubsaharan AfricanSudaneseSwedishSwissSyrianTaiwaneseThaiTlingit-HaidaTohono O'OdhamTonganTrinidadian and TobagonianTsimshianTurkishU.S. Virgin IslanderUgandanUkrainianUruguayanUteVenezuelanVietnameseWelshWest IndianYakamaYaquiYugoslavianYumanYup'ikZimbabwean
Immigration
NonimmigrantsImmigrantsAfghanistanAfricaAlbaniaArgentinaArmeniaAsiaAustraliaAustriaBahamasBangladeshBarbadosBelarusBelgiumBelizeBoliviaBosnia and HerzegovinaBrazilBulgariaBurma/MyanmarCabo VerdeCambodiaCameroonCanadaCaribbeanCentral AmericaChileChinaColombiaCongoCosta RicaCroatiaCubaCzechoslovakiaDenmarkDominicaDominican RepublicEastern AfricaEastern AsiaEastern EuropeEcuadorEgyptEl SalvadorEnglandEritreaEthiopiaEuropeFijiFranceGermanyGhanaGreeceGrenadaGuatemalaGuyanaHaitiHondurasHong KongHungaryIndiaIndonesiaIranIraqIrelandIsraelItalyJamaicaJapanJordanKazakhstanKenyaKoreaKuwaitLaosLatin AmericaLatviaLebanonLiberiaLithuaniaMalaysiaMexicoMicronesiaMiddle AfricaMoldovaMoroccoNepalNetherlandsNicaraguaNigeriaNorth AmericaNorth MacedoniaNorthern AfricaNorthern EuropeNorwayOceaniaPakistanPanamaPeruPhilippinesPolandPortugalRomaniaRussiaSaudi ArabiaScotlandSenegalSerbiaSierra LeoneSingaporeSomaliaSouth AfricaSouth AmericaSouth Central AsiaSouth Eastern AsiaSouthern EuropeSpainSt. Vincent and the GrenadinesSudanSwedenSwitzerlandSyriaTaiwanThailandTrinidad and TobagoTurkeyUgandaUkraineUruguayUzbekistanVenezuelaVietnamWest IndiesWestern AfricaWestern AsiaWestern EuropeYemenZaireZimbabweAzores
Unemployment Among Seniors over 65 years
Income
Poverty
Unemployment
Labor Participation
Family Structure
Vehicle Availability
Education Level
Disability

Unemployment Among Seniors over 65 years Comparison

Immigrants from Sri Lanka

Central Americans

Excellent
Tragic
5.1%
UNEMPLOYMENT AMONG SENIORS OVER 65 YEARS
87.4/ 100
METRIC RATING
126th/ 347
METRIC RANK
5.5%
UNEMPLOYMENT AMONG SENIORS OVER 65 YEARS
0.0/ 100
METRIC RATING
285th/ 347
METRIC RANK

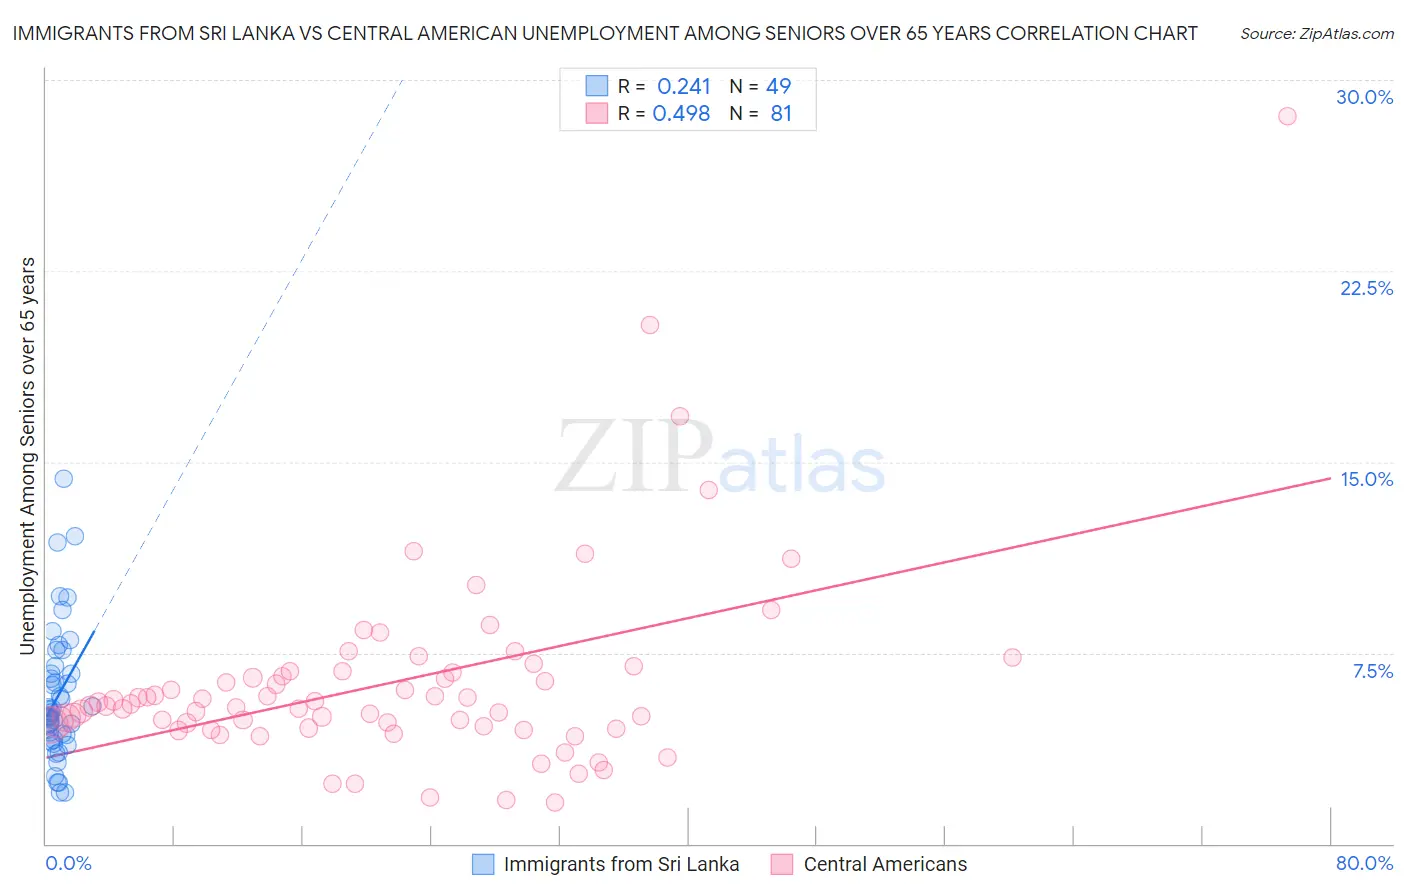
Immigrants from Sri Lanka vs Central American Unemployment Among Seniors over 65 years Correlation Chart

The statistical analysis conducted on geographies consisting of 144,085,528 people shows a weak positive correlation between the proportion of Immigrants from Sri Lanka and unemployment rate amomg seniors over the age of 65 in the United States with a correlation coefficient (R) of 0.241 and weighted average of 5.1%. Similarly, the statistical analysis conducted on geographies consisting of 433,188,019 people shows a moderate positive correlation between the proportion of Central Americans and unemployment rate amomg seniors over the age of 65 in the United States with a correlation coefficient (R) of 0.498 and weighted average of 5.5%, a difference of 8.5%.
Immigrants from Sri Lanka vs Central American Unemployment Among Seniors over 65 years

Unemployment Among Seniors over 65 years Correlation Summary

MeasurementImmigrants from Sri LankaCentral American
Minimum2.0%1.6%
Maximum14.3%28.6%
Range12.3%27.0%
Mean5.8%6.3%
Median5.1%5.4%
Interquartile 25% (IQ1)4.2%4.6%
Interquartile 75% (IQ3)6.8%6.8%
Interquartile Range (IQR)2.6%2.2%
Standard Deviation (Sample)2.6%3.9%
Standard Deviation (Population)2.6%3.9%

Similar Demographics by Unemployment Among Seniors over 65 years

Demographics Similar to Immigrants from Sri Lanka by Unemployment Among Seniors over 65 years

In terms of unemployment among seniors over 65 years, the demographic groups most similar to Immigrants from Sri Lanka are Sri Lankan (5.1%, a difference of 0.0%), Dutch (5.1%, a difference of 0.020%), Australian (5.1%, a difference of 0.020%), Immigrants from North America (5.1%, a difference of 0.040%), and Immigrants from England (5.1%, a difference of 0.050%).
DemographicsRating | RankUnemployment Among Seniors over 65 years
Immigrants | Canada
89.7
/100
|
#119
Excellent
5.1%
Irish
88.8
/100
|
#120
Excellent
5.1%
Puget Sound Salish
88.7
/100
|
#121
Excellent
5.1%
Immigrants | Cameroon
88.6
/100
|
#122
Excellent
5.1%
Asians
88.5
/100
|
#123
Excellent
5.1%
Immigrants | North America
87.9
/100
|
#124
Excellent
5.1%
Dutch
87.6
/100
|
#125
Excellent
5.1%
Immigrants | Sri Lanka
87.4
/100
|
#126
Excellent
5.1%
Sri Lankans
87.4
/100
|
#127
Excellent
5.1%
Australians
87.1
/100
|
#128
Excellent
5.1%
Immigrants | England
86.7
/100
|
#129
Excellent
5.1%
Iranians
86.6
/100
|
#130
Excellent
5.1%
Immigrants | Australia
85.8
/100
|
#131
Excellent
5.1%
Chileans
85.6
/100
|
#132
Excellent
5.1%
Syrians
85.3
/100
|
#133
Excellent
5.1%

Demographics Similar to Central Americans by Unemployment Among Seniors over 65 years

In terms of unemployment among seniors over 65 years, the demographic groups most similar to Central Americans are Immigrants from Barbados (5.5%, a difference of 0.030%), Venezuelan (5.5%, a difference of 0.050%), Immigrants from Liberia (5.5%, a difference of 0.060%), U.S. Virgin Islander (5.5%, a difference of 0.060%), and Immigrants from Cabo Verde (5.5%, a difference of 0.080%).
DemographicsRating | RankUnemployment Among Seniors over 65 years
Colville
0.1
/100
|
#278
Tragic
5.4%
Brazilians
0.1
/100
|
#279
Tragic
5.5%
Immigrants | South America
0.1
/100
|
#280
Tragic
5.5%
Immigrants | Norway
0.0
/100
|
#281
Tragic
5.5%
Immigrants | Belize
0.0
/100
|
#282
Tragic
5.5%
Immigrants | Haiti
0.0
/100
|
#283
Tragic
5.5%
Immigrants | Liberia
0.0
/100
|
#284
Tragic
5.5%
Central Americans
0.0
/100
|
#285
Tragic
5.5%
Immigrants | Barbados
0.0
/100
|
#286
Tragic
5.5%
Venezuelans
0.0
/100
|
#287
Tragic
5.5%
U.S. Virgin Islanders
0.0
/100
|
#288
Tragic
5.5%
Immigrants | Cabo Verde
0.0
/100
|
#289
Tragic
5.5%
Jamaicans
0.0
/100
|
#290
Tragic
5.5%
Blacks/African Americans
0.0
/100
|
#291
Tragic
5.5%
Belizeans
0.0
/100
|
#292
Tragic
5.5%