Immigrants from Sri Lanka vs Central American Poverty
COMPARE
Immigrants from Sri Lanka
Central American
Poverty
Poverty Comparison
Immigrants from Sri Lanka
Central Americans
11.2%
POVERTY
97.9/ 100
METRIC RATING
60th/ 347
METRIC RANK
14.6%
POVERTY
0.1/ 100
METRIC RATING
270th/ 347
METRIC RANK
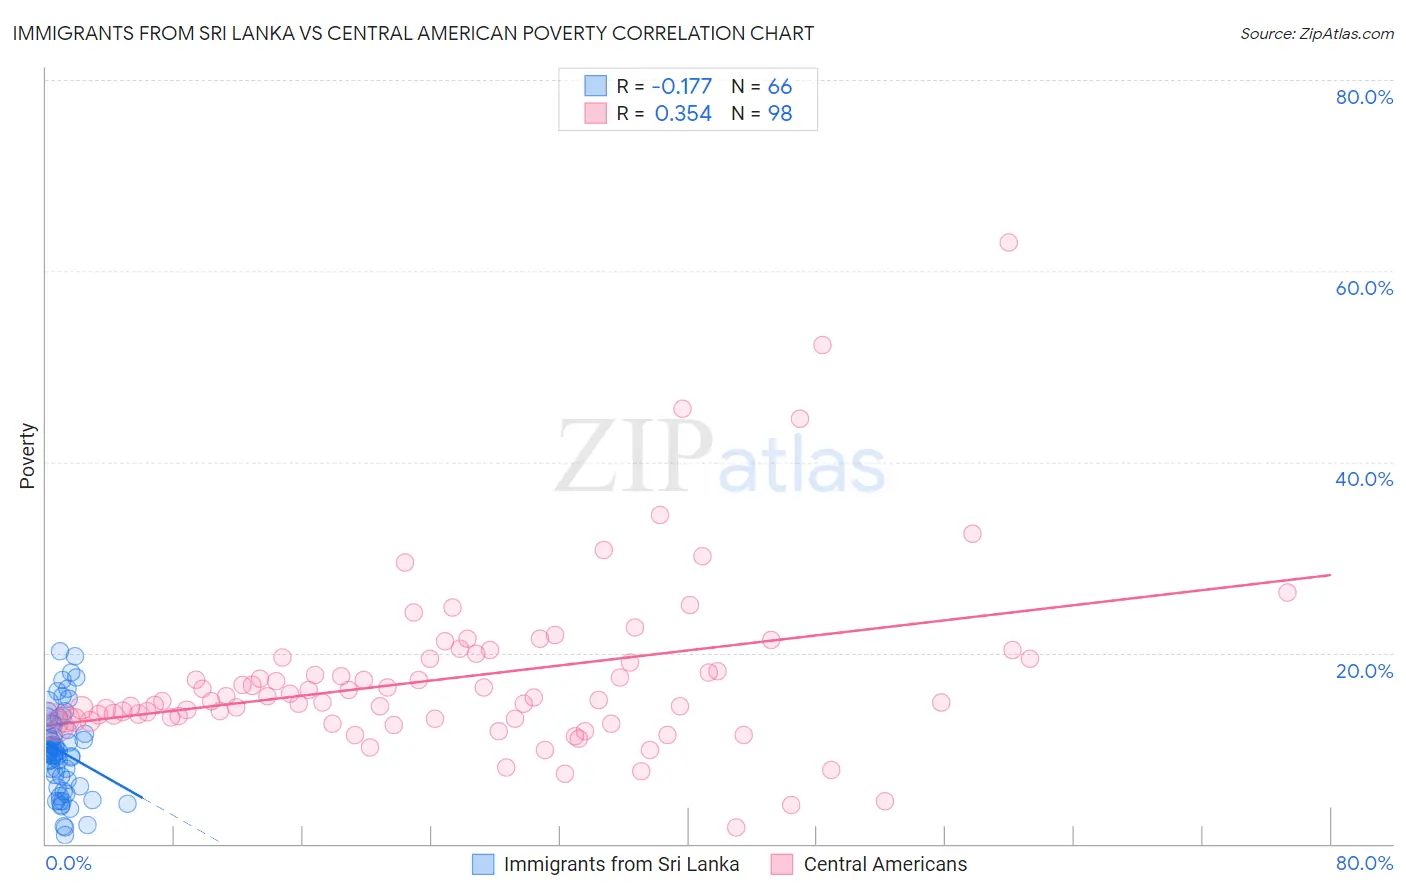
Immigrants from Sri Lanka vs Central American Poverty Correlation Chart
The statistical analysis conducted on geographies consisting of 149,683,532 people shows a poor negative correlation between the proportion of Immigrants from Sri Lanka and poverty level in the United States with a correlation coefficient (R) of -0.177 and weighted average of 11.2%. Similarly, the statistical analysis conducted on geographies consisting of 504,069,914 people shows a mild positive correlation between the proportion of Central Americans and poverty level in the United States with a correlation coefficient (R) of 0.354 and weighted average of 14.6%, a difference of 30.5%.
Poverty Correlation Summary
| Measurement | Immigrants from Sri Lanka | Central American |
| Minimum | 0.89% | 1.8% |
| Maximum | 20.2% | 62.9% |
| Range | 19.3% | 61.2% |
| Mean | 9.6% | 17.4% |
| Median | 9.6% | 15.0% |
| Interquartile 25% (IQ1) | 6.0% | 13.0% |
| Interquartile 75% (IQ3) | 12.4% | 19.4% |
| Interquartile Range (IQR) | 6.4% | 6.3% |
| Standard Deviation (Sample) | 4.5% | 9.1% |
| Standard Deviation (Population) | 4.4% | 9.1% |
Similar Demographics by Poverty
Demographics Similar to Immigrants from Sri Lanka by Poverty
In terms of poverty, the demographic groups most similar to Immigrants from Sri Lanka are Immigrants from Italy (11.2%, a difference of 0.060%), Austrian (11.2%, a difference of 0.10%), Ukrainian (11.2%, a difference of 0.10%), Immigrants from Europe (11.2%, a difference of 0.16%), and German (11.1%, a difference of 0.31%).
| Demographics | Rating | Rank | Poverty |
| Immigrants | Austria | 98.6 /100 | #53 | Exceptional 11.1% |
| Immigrants | Bulgaria | 98.5 /100 | #54 | Exceptional 11.1% |
| Immigrants | Serbia | 98.5 /100 | #55 | Exceptional 11.1% |
| Estonians | 98.2 /100 | #56 | Exceptional 11.1% |
| Scandinavians | 98.2 /100 | #57 | Exceptional 11.1% |
| Germans | 98.1 /100 | #58 | Exceptional 11.1% |
| Immigrants | Europe | 98.0 /100 | #59 | Exceptional 11.2% |
| Immigrants | Sri Lanka | 97.9 /100 | #60 | Exceptional 11.2% |
| Immigrants | Italy | 97.9 /100 | #61 | Exceptional 11.2% |
| Austrians | 97.8 /100 | #62 | Exceptional 11.2% |
| Ukrainians | 97.8 /100 | #63 | Exceptional 11.2% |
| Swiss | 97.7 /100 | #64 | Exceptional 11.2% |
| Immigrants | Asia | 97.5 /100 | #65 | Exceptional 11.2% |
| Immigrants | Netherlands | 97.5 /100 | #66 | Exceptional 11.2% |
| Immigrants | Australia | 97.4 /100 | #67 | Exceptional 11.2% |
Demographics Similar to Central Americans by Poverty
In terms of poverty, the demographic groups most similar to Central Americans are Immigrants from Cuba (14.6%, a difference of 0.14%), Subsaharan African (14.5%, a difference of 0.29%), Iroquois (14.5%, a difference of 0.33%), Shoshone (14.7%, a difference of 0.58%), and Chickasaw (14.7%, a difference of 0.63%).
| Demographics | Rating | Rank | Poverty |
| Jamaicans | 0.1 /100 | #263 | Tragic 14.4% |
| Immigrants | Jamaica | 0.1 /100 | #264 | Tragic 14.4% |
| Immigrants | Guyana | 0.1 /100 | #265 | Tragic 14.5% |
| Guyanese | 0.1 /100 | #266 | Tragic 14.5% |
| Iroquois | 0.1 /100 | #267 | Tragic 14.5% |
| Sub-Saharan Africans | 0.1 /100 | #268 | Tragic 14.5% |
| Immigrants | Cuba | 0.1 /100 | #269 | Tragic 14.6% |
| Central Americans | 0.1 /100 | #270 | Tragic 14.6% |
| Shoshone | 0.0 /100 | #271 | Tragic 14.7% |
| Chickasaw | 0.0 /100 | #272 | Tragic 14.7% |
| Spanish Americans | 0.0 /100 | #273 | Tragic 14.7% |
| Barbadians | 0.0 /100 | #274 | Tragic 14.8% |
| Immigrants | West Indies | 0.0 /100 | #275 | Tragic 14.8% |
| Immigrants | Bahamas | 0.0 /100 | #276 | Tragic 14.8% |
| Bangladeshis | 0.0 /100 | #277 | Tragic 14.8% |