Immigrants from South Central Asia vs Spaniard Male Unemployment
COMPARE
Immigrants from South Central Asia
Spaniard
Male Unemployment
Male Unemployment Comparison
Immigrants from South Central Asia
Spaniards
4.8%
MALE UNEMPLOYMENT
99.9/ 100
METRIC RATING
24th/ 347
METRIC RANK
5.3%
MALE UNEMPLOYMENT
35.1/ 100
METRIC RATING
184th/ 347
METRIC RANK
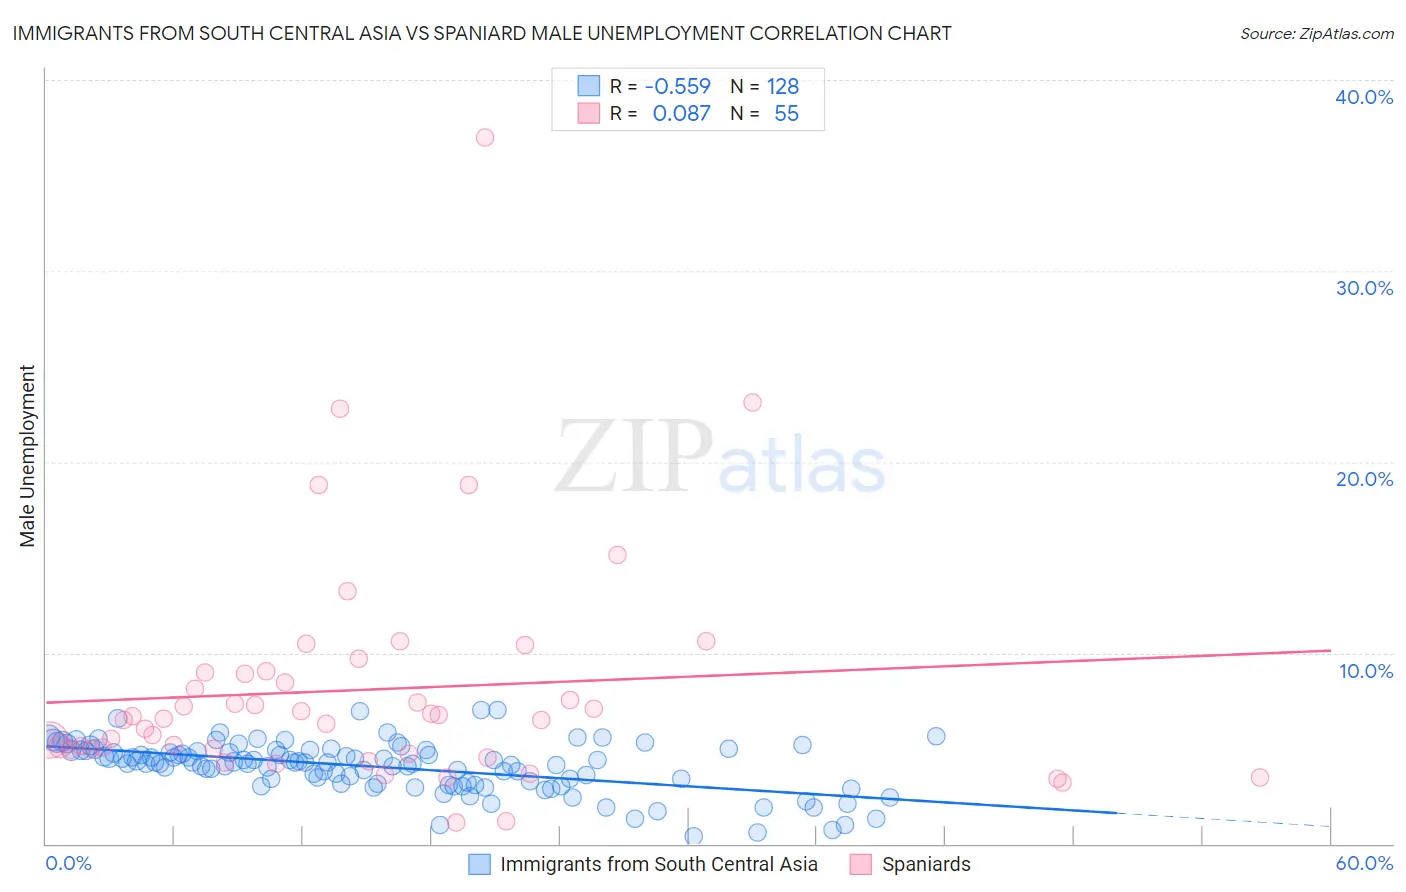
Immigrants from South Central Asia vs Spaniard Male Unemployment Correlation Chart
The statistical analysis conducted on geographies consisting of 470,335,187 people shows a substantial negative correlation between the proportion of Immigrants from South Central Asia and unemployment rate among males in the United States with a correlation coefficient (R) of -0.559 and weighted average of 4.8%. Similarly, the statistical analysis conducted on geographies consisting of 441,055,878 people shows a slight positive correlation between the proportion of Spaniards and unemployment rate among males in the United States with a correlation coefficient (R) of 0.087 and weighted average of 5.3%, a difference of 11.9%.
Male Unemployment Correlation Summary
| Measurement | Immigrants from South Central Asia | Spaniard |
| Minimum | 0.40% | 1.1% |
| Maximum | 7.0% | 37.0% |
| Range | 6.6% | 35.9% |
| Mean | 4.0% | 8.1% |
| Median | 4.2% | 6.6% |
| Interquartile 25% (IQ1) | 3.2% | 5.0% |
| Interquartile 75% (IQ3) | 4.9% | 8.9% |
| Interquartile Range (IQR) | 1.7% | 4.0% |
| Standard Deviation (Sample) | 1.3% | 6.1% |
| Standard Deviation (Population) | 1.3% | 6.0% |
Similar Demographics by Male Unemployment
Demographics Similar to Immigrants from South Central Asia by Male Unemployment
In terms of male unemployment, the demographic groups most similar to Immigrants from South Central Asia are Tongan (4.8%, a difference of 0.030%), Carpatho Rusyn (4.8%, a difference of 0.070%), Immigrants from Taiwan (4.8%, a difference of 0.090%), Zimbabwean (4.8%, a difference of 0.10%), and Dutch (4.8%, a difference of 0.12%).
| Demographics | Rating | Rank | Male Unemployment |
| Filipinos | 99.9 /100 | #17 | Exceptional 4.7% |
| English | 99.9 /100 | #18 | Exceptional 4.8% |
| Europeans | 99.9 /100 | #19 | Exceptional 4.8% |
| Pennsylvania Germans | 99.9 /100 | #20 | Exceptional 4.8% |
| Immigrants | Taiwan | 99.9 /100 | #21 | Exceptional 4.8% |
| Carpatho Rusyns | 99.9 /100 | #22 | Exceptional 4.8% |
| Tongans | 99.9 /100 | #23 | Exceptional 4.8% |
| Immigrants | South Central Asia | 99.9 /100 | #24 | Exceptional 4.8% |
| Zimbabweans | 99.9 /100 | #25 | Exceptional 4.8% |
| Dutch | 99.9 /100 | #26 | Exceptional 4.8% |
| Belgians | 99.9 /100 | #27 | Exceptional 4.8% |
| Bulgarians | 99.8 /100 | #28 | Exceptional 4.8% |
| Scottish | 99.8 /100 | #29 | Exceptional 4.8% |
| British | 99.8 /100 | #30 | Exceptional 4.8% |
| Sudanese | 99.8 /100 | #31 | Exceptional 4.8% |
Demographics Similar to Spaniards by Male Unemployment
In terms of male unemployment, the demographic groups most similar to Spaniards are Korean (5.3%, a difference of 0.010%), Taiwanese (5.3%, a difference of 0.16%), Potawatomi (5.3%, a difference of 0.17%), Immigrants from Afghanistan (5.3%, a difference of 0.18%), and Iraqi (5.4%, a difference of 0.23%).
| Demographics | Rating | Rank | Male Unemployment |
| Immigrants | Peru | 44.6 /100 | #177 | Average 5.3% |
| Osage | 42.5 /100 | #178 | Average 5.3% |
| Immigrants | Oceania | 40.8 /100 | #179 | Average 5.3% |
| Malaysians | 39.6 /100 | #180 | Fair 5.3% |
| Immigrants | Afghanistan | 37.9 /100 | #181 | Fair 5.3% |
| Potawatomi | 37.8 /100 | #182 | Fair 5.3% |
| Taiwanese | 37.6 /100 | #183 | Fair 5.3% |
| Spaniards | 35.1 /100 | #184 | Fair 5.3% |
| Koreans | 34.9 /100 | #185 | Fair 5.3% |
| Iraqis | 31.6 /100 | #186 | Fair 5.4% |
| Costa Ricans | 31.3 /100 | #187 | Fair 5.4% |
| Arabs | 30.2 /100 | #188 | Fair 5.4% |
| Immigrants | South America | 29.4 /100 | #189 | Fair 5.4% |
| Immigrants | Uganda | 28.8 /100 | #190 | Fair 5.4% |
| Immigrants | South Eastern Asia | 28.2 /100 | #191 | Fair 5.4% |