Immigrants from South Central Asia vs Immigrants from Egypt Male Unemployment

COMPARE

Immigrants from South Central Asia
Race
Ancestry
AfghanAfricanAlaska NativeAlaskan AthabascanAlbanianAleutAlsatianAmericanApacheArabArapahoArgentineanArmenianAssyrian/Chaldean/SyriacAustralianAustrianBahamianBangladeshiBarbadianBasqueBelgianBelizeanBermudanBhutaneseBlackfeetBolivianBrazilianBritishBritish West IndianBulgarianBurmeseCajunCambodianCanadianCape VerdeanCarpatho RusynCelticCentral AmericanCentral American IndianCherokeeCheyenneChickasawChileanChineseChippewaChoctawColombianColvilleComancheCosta RicanCreeCreekCroatianCrowCubanCypriotCzechCzechoslovakianDanishDelawareDominicanDutchDutch West IndianEastern EuropeanEcuadorianEgyptianEnglishEstonianEthiopianEuropeanFijianFilipinoFinnishFrenchFrench American IndianFrench CanadianGermanGerman RussianGhanaianGreekGuamanian/ChamorroGuatemalanGuyaneseHaitianHmongHonduranHopiHoumaHungarianIcelanderIndian (Asian)IndonesianInupiatIranianIraqiIrishIroquoisIsraeliItalianJamaicanJapaneseJordanianKenyanKiowaKoreanLaotianLatvianLebaneseLiberianLithuanianLumbeeLuxembourgerMacedonianMalaysianMalteseMarshalleseMenomineeMexicanMexican American IndianMongolianMoroccanNative HawaiianNavajoNepaleseNew ZealanderNicaraguanNigerianNorthern EuropeanNorwegianOkinawanOsageOttawaPaiutePakistaniPalestinianPanamanianParaguayanPennsylvania GermanPeruvianPimaPolishPortuguesePotawatomiPuebloPuerto RicanPuget Sound SalishRomanianRussianSalvadoranSamoanScandinavianScotch-IrishScottishSeminoleSenegaleseSerbianShoshoneSierra LeoneanSiouxSlavicSlovakSloveneSomaliSouth AfricanSouth AmericanSouth American IndianSoviet UnionSpaniardSpanishSpanish AmericanSpanish American IndianSri LankanSubsaharan AfricanSudaneseSwedishSwissSyrianTaiwaneseThaiTlingit-HaidaTohono O'OdhamTonganTrinidadian and TobagonianTsimshianTurkishU.S. Virgin IslanderUgandanUkrainianUruguayanUteVenezuelanVietnameseWelshWest IndianYakamaYaquiYugoslavianYumanYup'ikZimbabwean
Immigration
NonimmigrantsImmigrantsAfghanistanAfricaAlbaniaArgentinaArmeniaAsiaAustraliaAustriaBahamasBangladeshBarbadosBelarusBelgiumBelizeBoliviaBosnia and HerzegovinaBrazilBulgariaBurma/MyanmarCabo VerdeCambodiaCameroonCanadaCaribbeanCentral AmericaChileChinaColombiaCongoCosta RicaCroatiaCubaCzechoslovakiaDenmarkDominicaDominican RepublicEastern AfricaEastern AsiaEastern EuropeEcuadorEl SalvadorEnglandEritreaEthiopiaEuropeFijiFranceGermanyGhanaGreeceGrenadaGuatemalaGuyanaHaitiHondurasHong KongHungaryIndiaIndonesiaIranIraqIrelandIsraelItalyJamaicaJapanJordanKazakhstanKenyaKoreaKuwaitLaosLatin AmericaLatviaLebanonLiberiaLithuaniaMalaysiaMexicoMicronesiaMiddle AfricaMoldovaMoroccoNepalNetherlandsNicaraguaNigeriaNorth AmericaNorth MacedoniaNorthern AfricaNorthern EuropeNorwayOceaniaPakistanPanamaPeruPhilippinesPolandPortugalRomaniaRussiaSaudi ArabiaScotlandSenegalSerbiaSierra LeoneSingaporeSomaliaSouth AfricaSouth AmericaSouth Central AsiaSouth Eastern AsiaSouthern EuropeSpainSri LankaSt. Vincent and the GrenadinesSudanSwedenSwitzerlandSyriaTaiwanThailandTrinidad and TobagoTurkeyUgandaUkraineUruguayUzbekistanVenezuelaVietnamWest IndiesWestern AfricaWestern AsiaWestern EuropeYemenZaireZimbabweAzores
Immigrants from Egypt
Race
Ancestry
AfghanAfricanAlaska NativeAlaskan AthabascanAlbanianAleutAlsatianAmericanApacheArabArapahoArgentineanArmenianAssyrian/Chaldean/SyriacAustralianAustrianBahamianBangladeshiBarbadianBasqueBelgianBelizeanBermudanBhutaneseBlackfeetBolivianBrazilianBritishBritish West IndianBulgarianBurmeseCajunCambodianCanadianCape VerdeanCarpatho RusynCelticCentral AmericanCentral American IndianCherokeeCheyenneChickasawChileanChineseChippewaChoctawColombianColvilleComancheCosta RicanCreeCreekCroatianCrowCubanCypriotCzechCzechoslovakianDanishDelawareDominicanDutchDutch West IndianEastern EuropeanEcuadorianEgyptianEnglishEstonianEthiopianEuropeanFijianFilipinoFinnishFrenchFrench American IndianFrench CanadianGermanGerman RussianGhanaianGreekGuamanian/ChamorroGuatemalanGuyaneseHaitianHmongHonduranHopiHoumaHungarianIcelanderIndian (Asian)IndonesianInupiatIranianIraqiIrishIroquoisIsraeliItalianJamaicanJapaneseJordanianKenyanKiowaKoreanLaotianLatvianLebaneseLiberianLithuanianLumbeeLuxembourgerMacedonianMalaysianMalteseMarshalleseMenomineeMexicanMexican American IndianMongolianMoroccanNative HawaiianNavajoNepaleseNew ZealanderNicaraguanNigerianNorthern EuropeanNorwegianOkinawanOsageOttawaPaiutePakistaniPalestinianPanamanianParaguayanPennsylvania GermanPeruvianPimaPolishPortuguesePotawatomiPuebloPuerto RicanPuget Sound SalishRomanianRussianSalvadoranSamoanScandinavianScotch-IrishScottishSeminoleSenegaleseSerbianShoshoneSierra LeoneanSiouxSlavicSlovakSloveneSomaliSouth AfricanSouth AmericanSouth American IndianSoviet UnionSpaniardSpanishSpanish AmericanSpanish American IndianSri LankanSubsaharan AfricanSudaneseSwedishSwissSyrianTaiwaneseThaiTlingit-HaidaTohono O'OdhamTonganTrinidadian and TobagonianTsimshianTurkishU.S. Virgin IslanderUgandanUkrainianUruguayanUteVenezuelanVietnameseWelshWest IndianYakamaYaquiYugoslavianYumanYup'ikZimbabwean
Immigration
NonimmigrantsImmigrantsAfghanistanAfricaAlbaniaArgentinaArmeniaAsiaAustraliaAustriaBahamasBangladeshBarbadosBelarusBelgiumBelizeBoliviaBosnia and HerzegovinaBrazilBulgariaBurma/MyanmarCabo VerdeCambodiaCameroonCanadaCaribbeanCentral AmericaChileChinaColombiaCongoCosta RicaCroatiaCubaCzechoslovakiaDenmarkDominicaDominican RepublicEastern AfricaEastern AsiaEastern EuropeEcuadorEgyptEl SalvadorEnglandEritreaEthiopiaEuropeFijiFranceGermanyGhanaGreeceGrenadaGuatemalaGuyanaHaitiHondurasHong KongHungaryIndiaIndonesiaIranIraqIrelandIsraelItalyJamaicaJapanJordanKazakhstanKenyaKoreaKuwaitLaosLatin AmericaLatviaLebanonLiberiaLithuaniaMalaysiaMexicoMicronesiaMiddle AfricaMoldovaMoroccoNepalNetherlandsNicaraguaNigeriaNorth AmericaNorth MacedoniaNorthern AfricaNorthern EuropeNorwayOceaniaPakistanPanamaPeruPhilippinesPolandPortugalRomaniaRussiaSaudi ArabiaScotlandSenegalSerbiaSierra LeoneSingaporeSomaliaSouth AfricaSouth AmericaSouth Eastern AsiaSouthern EuropeSpainSri LankaSt. Vincent and the GrenadinesSudanSwedenSwitzerlandSyriaTaiwanThailandTrinidad and TobagoTurkeyUgandaUkraineUruguayUzbekistanVenezuelaVietnamWest IndiesWestern AfricaWestern AsiaWestern EuropeYemenZaireZimbabweAzores
Male Unemployment
Income
Poverty
Unemployment
Labor Participation
Family Structure
Vehicle Availability
Education Level
Disability

Male Unemployment Comparison

Immigrants from South Central Asia

Immigrants from Egypt

Exceptional
Good
4.8%
MALE UNEMPLOYMENT
99.9/ 100
METRIC RATING
24th/ 347
METRIC RANK
5.2%
MALE UNEMPLOYMENT
65.9/ 100
METRIC RATING
162nd/ 347
METRIC RANK

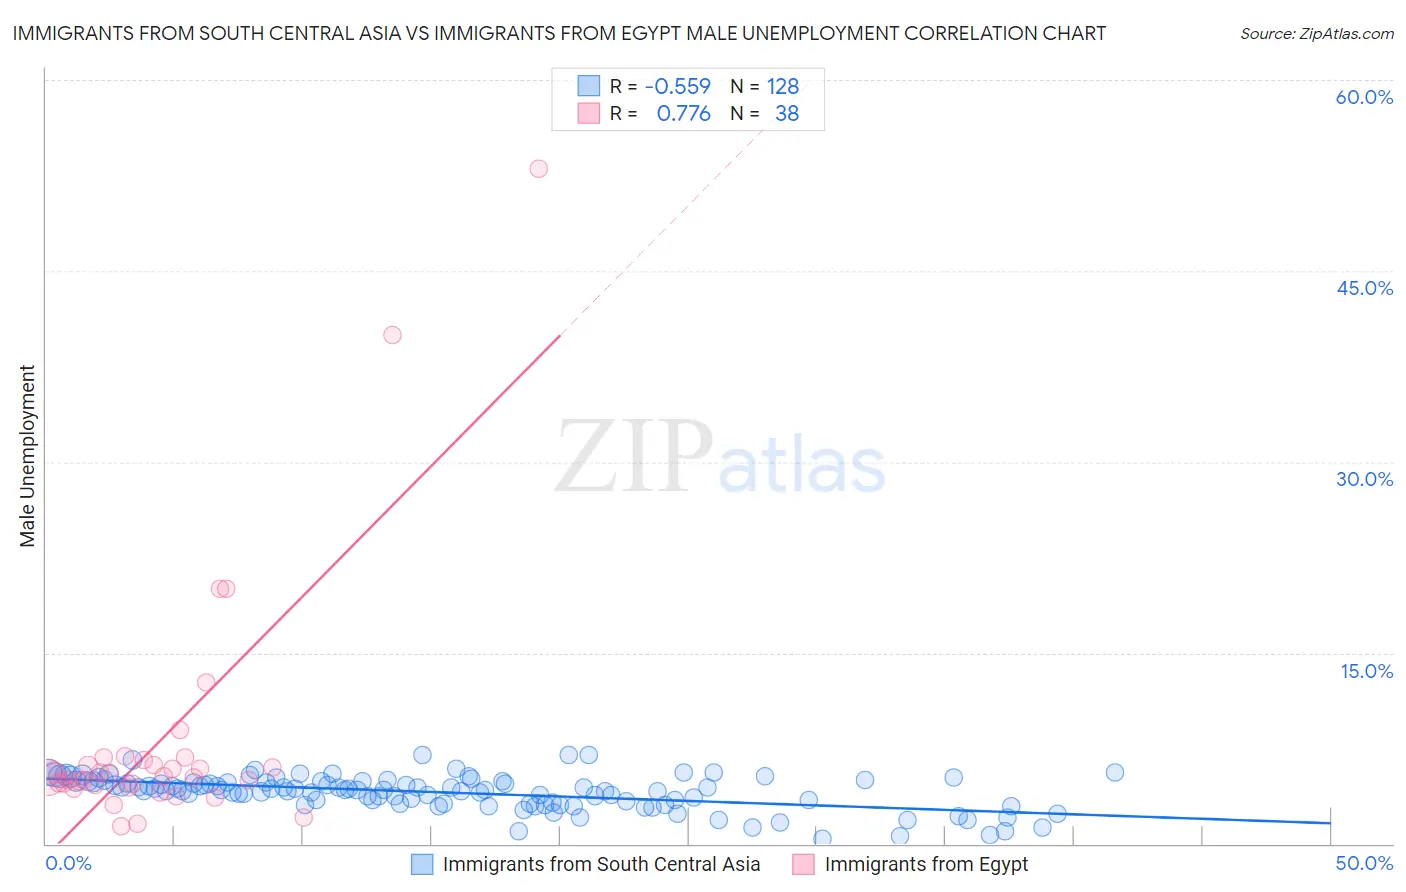
Immigrants from South Central Asia vs Immigrants from Egypt Male Unemployment Correlation Chart

The statistical analysis conducted on geographies consisting of 470,335,187 people shows a substantial negative correlation between the proportion of Immigrants from South Central Asia and unemployment rate among males in the United States with a correlation coefficient (R) of -0.559 and weighted average of 4.8%. Similarly, the statistical analysis conducted on geographies consisting of 245,171,994 people shows a strong positive correlation between the proportion of Immigrants from Egypt and unemployment rate among males in the United States with a correlation coefficient (R) of 0.776 and weighted average of 5.2%, a difference of 9.9%.
Immigrants from South Central Asia vs Immigrants from Egypt Male Unemployment

Male Unemployment Correlation Summary

MeasurementImmigrants from South Central AsiaImmigrants from Egypt
Minimum0.40%1.4%
Maximum7.0%53.0%
Range6.6%51.6%
Mean4.0%8.2%
Median4.2%5.3%
Interquartile 25% (IQ1)3.2%4.6%
Interquartile 75% (IQ3)4.9%6.6%
Interquartile Range (IQR)1.7%2.0%
Standard Deviation (Sample)1.3%10.0%
Standard Deviation (Population)1.3%9.9%

Similar Demographics by Male Unemployment

Demographics Similar to Immigrants from South Central Asia by Male Unemployment

In terms of male unemployment, the demographic groups most similar to Immigrants from South Central Asia are Tongan (4.8%, a difference of 0.030%), Carpatho Rusyn (4.8%, a difference of 0.070%), Immigrants from Taiwan (4.8%, a difference of 0.090%), Zimbabwean (4.8%, a difference of 0.10%), and Dutch (4.8%, a difference of 0.12%).
DemographicsRating | RankMale Unemployment
Filipinos
99.9
/100
|
#17
Exceptional
4.7%
English
99.9
/100
|
#18
Exceptional
4.8%
Europeans
99.9
/100
|
#19
Exceptional
4.8%
Pennsylvania Germans
99.9
/100
|
#20
Exceptional
4.8%
Immigrants | Taiwan
99.9
/100
|
#21
Exceptional
4.8%
Carpatho Rusyns
99.9
/100
|
#22
Exceptional
4.8%
Tongans
99.9
/100
|
#23
Exceptional
4.8%
Immigrants | South Central Asia
99.9
/100
|
#24
Exceptional
4.8%
Zimbabweans
99.9
/100
|
#25
Exceptional
4.8%
Dutch
99.9
/100
|
#26
Exceptional
4.8%
Belgians
99.9
/100
|
#27
Exceptional
4.8%
Bulgarians
99.8
/100
|
#28
Exceptional
4.8%
Scottish
99.8
/100
|
#29
Exceptional
4.8%
British
99.8
/100
|
#30
Exceptional
4.8%
Sudanese
99.8
/100
|
#31
Exceptional
4.8%

Demographics Similar to Immigrants from Egypt by Male Unemployment

In terms of male unemployment, the demographic groups most similar to Immigrants from Egypt are Immigrants from Hong Kong (5.2%, a difference of 0.010%), Afghan (5.3%, a difference of 0.25%), Immigrants from China (5.2%, a difference of 0.32%), South American (5.3%, a difference of 0.33%), and Immigrants from Norway (5.2%, a difference of 0.35%).
DemographicsRating | RankMale Unemployment
Immigrants | Hungary
73.4
/100
|
#155
Good
5.2%
Americans
72.7
/100
|
#156
Good
5.2%
Immigrants | Northern Africa
72.3
/100
|
#157
Good
5.2%
Immigrants | Indonesia
71.5
/100
|
#158
Good
5.2%
Indonesians
71.2
/100
|
#159
Good
5.2%
Immigrants | Norway
71.0
/100
|
#160
Good
5.2%
Immigrants | China
70.6
/100
|
#161
Good
5.2%
Immigrants | Egypt
65.9
/100
|
#162
Good
5.2%
Immigrants | Hong Kong
65.7
/100
|
#163
Good
5.2%
Afghans
62.0
/100
|
#164
Good
5.3%
South Americans
60.6
/100
|
#165
Good
5.3%
Immigrants | Morocco
60.2
/100
|
#166
Good
5.3%
Immigrants | Vietnam
58.1
/100
|
#167
Average
5.3%
Immigrants | Ireland
57.7
/100
|
#168
Average
5.3%
Immigrants | Congo
57.4
/100
|
#169
Average
5.3%