Immigrants from South Central Asia vs Immigrants from Latin America Female Unemployment
COMPARE
Immigrants from South Central Asia
Immigrants from Latin America
Female Unemployment
Female Unemployment Comparison
Immigrants from South Central Asia
Immigrants from Latin America
5.0%
FEMALE UNEMPLOYMENT
95.5/ 100
METRIC RATING
96th/ 347
METRIC RANK
6.1%
FEMALE UNEMPLOYMENT
0.0/ 100
METRIC RATING
295th/ 347
METRIC RANK
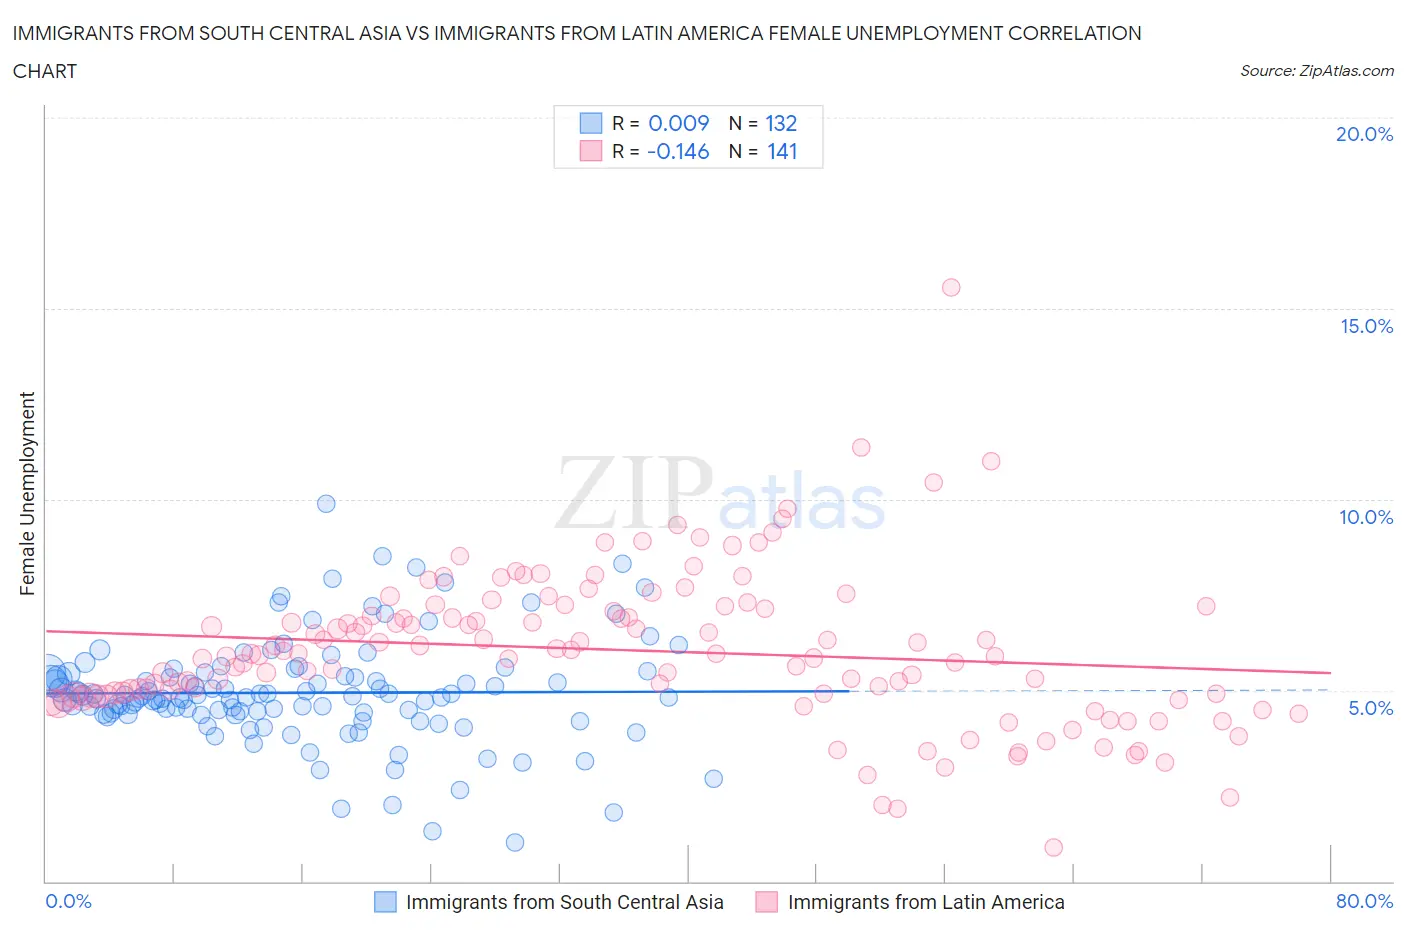
Immigrants from South Central Asia vs Immigrants from Latin America Female Unemployment Correlation Chart
The statistical analysis conducted on geographies consisting of 470,050,410 people shows no correlation between the proportion of Immigrants from South Central Asia and unemploymnet rate among females in the United States with a correlation coefficient (R) of 0.009 and weighted average of 5.0%. Similarly, the statistical analysis conducted on geographies consisting of 548,551,926 people shows a poor negative correlation between the proportion of Immigrants from Latin America and unemploymnet rate among females in the United States with a correlation coefficient (R) of -0.146 and weighted average of 6.1%, a difference of 22.0%.
Female Unemployment Correlation Summary
| Measurement | Immigrants from South Central Asia | Immigrants from Latin America |
| Minimum | 1.0% | 0.90% |
| Maximum | 9.9% | 15.5% |
| Range | 8.9% | 14.6% |
| Mean | 4.9% | 6.1% |
| Median | 4.8% | 6.0% |
| Interquartile 25% (IQ1) | 4.4% | 4.9% |
| Interquartile 75% (IQ3) | 5.4% | 7.2% |
| Interquartile Range (IQR) | 1.0% | 2.3% |
| Standard Deviation (Sample) | 1.4% | 2.0% |
| Standard Deviation (Population) | 1.4% | 2.0% |
Similar Demographics by Female Unemployment
Demographics Similar to Immigrants from South Central Asia by Female Unemployment
In terms of female unemployment, the demographic groups most similar to Immigrants from South Central Asia are Burmese (5.0%, a difference of 0.040%), Immigrants from Malaysia (5.0%, a difference of 0.060%), Immigrants from Austria (5.0%, a difference of 0.090%), Immigrants from Somalia (5.0%, a difference of 0.11%), and Immigrants from Kuwait (5.0%, a difference of 0.11%).
| Demographics | Rating | Rank | Female Unemployment |
| Immigrants | Taiwan | 96.6 /100 | #89 | Exceptional 5.0% |
| Immigrants | Sweden | 96.3 /100 | #90 | Exceptional 5.0% |
| Immigrants | Japan | 96.0 /100 | #91 | Exceptional 5.0% |
| Romanians | 95.9 /100 | #92 | Exceptional 5.0% |
| Immigrants | Austria | 95.7 /100 | #93 | Exceptional 5.0% |
| Immigrants | Malaysia | 95.7 /100 | #94 | Exceptional 5.0% |
| Burmese | 95.6 /100 | #95 | Exceptional 5.0% |
| Immigrants | South Central Asia | 95.5 /100 | #96 | Exceptional 5.0% |
| Immigrants | Somalia | 95.2 /100 | #97 | Exceptional 5.0% |
| Immigrants | Kuwait | 95.2 /100 | #98 | Exceptional 5.0% |
| Immigrants | Zaire | 95.2 /100 | #99 | Exceptional 5.0% |
| Indonesians | 95.1 /100 | #100 | Exceptional 5.0% |
| Immigrants | Czechoslovakia | 95.0 /100 | #101 | Exceptional 5.0% |
| Immigrants | Kenya | 94.8 /100 | #102 | Exceptional 5.0% |
| Somalis | 94.6 /100 | #103 | Exceptional 5.0% |
Demographics Similar to Immigrants from Latin America by Female Unemployment
In terms of female unemployment, the demographic groups most similar to Immigrants from Latin America are Alaskan Athabascan (6.1%, a difference of 0.020%), West Indian (6.1%, a difference of 0.030%), Jamaican (6.1%, a difference of 0.050%), Immigrants from El Salvador (6.1%, a difference of 0.10%), and Ute (6.1%, a difference of 0.16%).
| Demographics | Rating | Rank | Female Unemployment |
| Haitians | 0.0 /100 | #288 | Tragic 6.1% |
| Trinidadians and Tobagonians | 0.0 /100 | #289 | Tragic 6.1% |
| Immigrants | Caribbean | 0.0 /100 | #290 | Tragic 6.1% |
| Immigrants | West Indies | 0.0 /100 | #291 | Tragic 6.1% |
| Immigrants | Trinidad and Tobago | 0.0 /100 | #292 | Tragic 6.1% |
| Mexicans | 0.0 /100 | #293 | Tragic 6.1% |
| Immigrants | El Salvador | 0.0 /100 | #294 | Tragic 6.1% |
| Immigrants | Latin America | 0.0 /100 | #295 | Tragic 6.1% |
| Alaskan Athabascans | 0.0 /100 | #296 | Tragic 6.1% |
| West Indians | 0.0 /100 | #297 | Tragic 6.1% |
| Jamaicans | 0.0 /100 | #298 | Tragic 6.1% |
| Ute | 0.0 /100 | #299 | Tragic 6.1% |
| Immigrants | Haiti | 0.0 /100 | #300 | Tragic 6.1% |
| Immigrants | Barbados | 0.0 /100 | #301 | Tragic 6.2% |
| U.S. Virgin Islanders | 0.0 /100 | #302 | Tragic 6.2% |