Immigrants from South Central Asia vs Immigrants from Jordan Female Unemployment
COMPARE
Immigrants from South Central Asia
Immigrants from Jordan
Female Unemployment
Female Unemployment Comparison
Immigrants from South Central Asia
Immigrants from Jordan
5.0%
FEMALE UNEMPLOYMENT
95.5/ 100
METRIC RATING
96th/ 347
METRIC RANK
5.1%
FEMALE UNEMPLOYMENT
80.4/ 100
METRIC RATING
144th/ 347
METRIC RANK
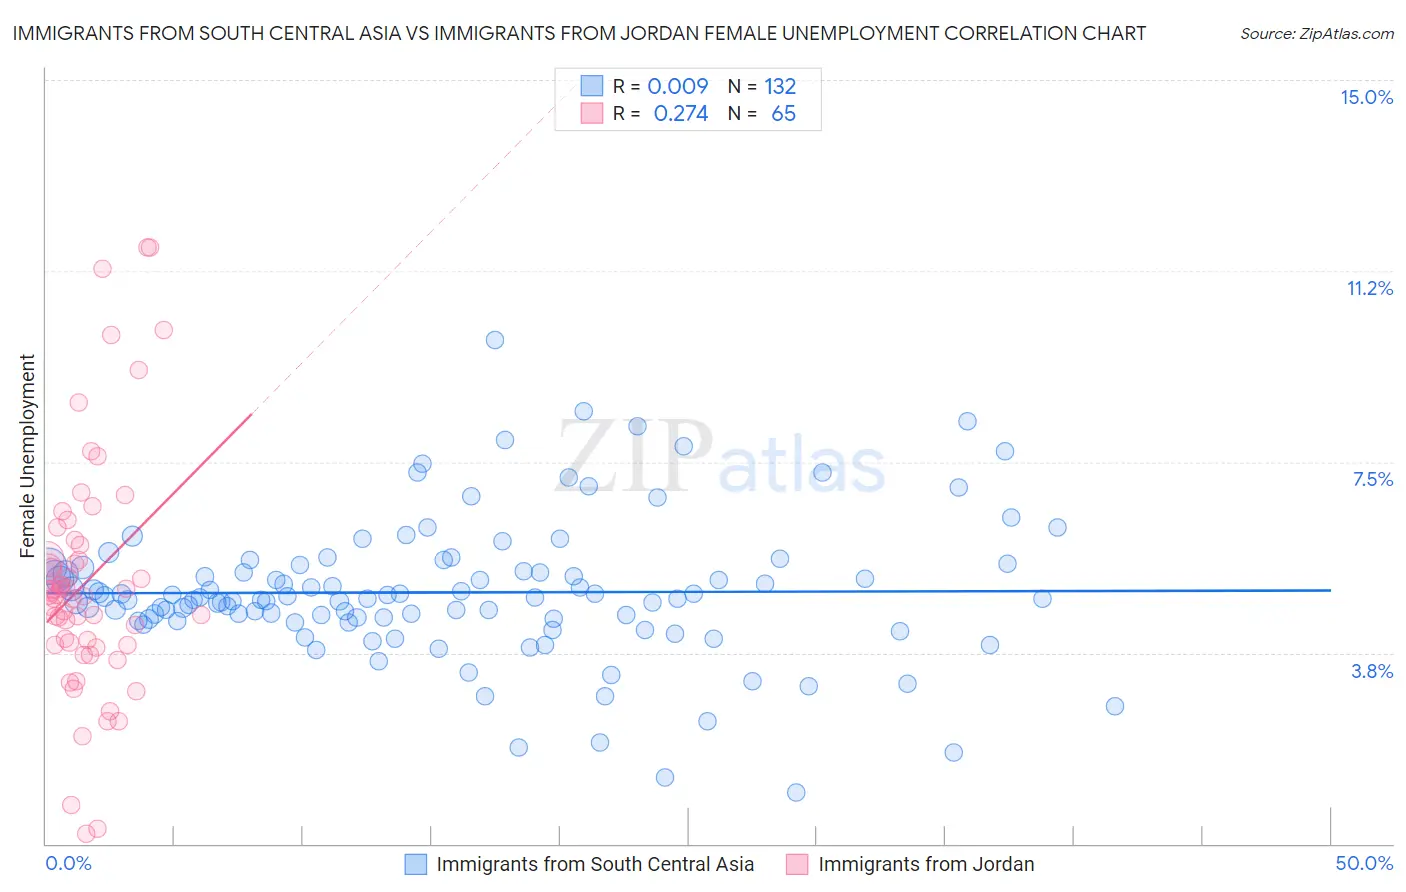
Immigrants from South Central Asia vs Immigrants from Jordan Female Unemployment Correlation Chart
The statistical analysis conducted on geographies consisting of 470,050,410 people shows no correlation between the proportion of Immigrants from South Central Asia and unemploymnet rate among females in the United States with a correlation coefficient (R) of 0.009 and weighted average of 5.0%. Similarly, the statistical analysis conducted on geographies consisting of 181,116,498 people shows a weak positive correlation between the proportion of Immigrants from Jordan and unemploymnet rate among females in the United States with a correlation coefficient (R) of 0.274 and weighted average of 5.1%, a difference of 2.6%.
Female Unemployment Correlation Summary
| Measurement | Immigrants from South Central Asia | Immigrants from Jordan |
| Minimum | 1.0% | 0.20% |
| Maximum | 9.9% | 11.7% |
| Range | 8.9% | 11.5% |
| Mean | 4.9% | 5.2% |
| Median | 4.8% | 4.9% |
| Interquartile 25% (IQ1) | 4.4% | 3.9% |
| Interquartile 75% (IQ3) | 5.4% | 5.9% |
| Interquartile Range (IQR) | 1.0% | 2.0% |
| Standard Deviation (Sample) | 1.4% | 2.4% |
| Standard Deviation (Population) | 1.4% | 2.4% |
Similar Demographics by Female Unemployment
Demographics Similar to Immigrants from South Central Asia by Female Unemployment
In terms of female unemployment, the demographic groups most similar to Immigrants from South Central Asia are Burmese (5.0%, a difference of 0.040%), Immigrants from Malaysia (5.0%, a difference of 0.060%), Immigrants from Austria (5.0%, a difference of 0.090%), Immigrants from Somalia (5.0%, a difference of 0.11%), and Immigrants from Kuwait (5.0%, a difference of 0.11%).
| Demographics | Rating | Rank | Female Unemployment |
| Immigrants | Taiwan | 96.6 /100 | #89 | Exceptional 5.0% |
| Immigrants | Sweden | 96.3 /100 | #90 | Exceptional 5.0% |
| Immigrants | Japan | 96.0 /100 | #91 | Exceptional 5.0% |
| Romanians | 95.9 /100 | #92 | Exceptional 5.0% |
| Immigrants | Austria | 95.7 /100 | #93 | Exceptional 5.0% |
| Immigrants | Malaysia | 95.7 /100 | #94 | Exceptional 5.0% |
| Burmese | 95.6 /100 | #95 | Exceptional 5.0% |
| Immigrants | South Central Asia | 95.5 /100 | #96 | Exceptional 5.0% |
| Immigrants | Somalia | 95.2 /100 | #97 | Exceptional 5.0% |
| Immigrants | Kuwait | 95.2 /100 | #98 | Exceptional 5.0% |
| Immigrants | Zaire | 95.2 /100 | #99 | Exceptional 5.0% |
| Indonesians | 95.1 /100 | #100 | Exceptional 5.0% |
| Immigrants | Czechoslovakia | 95.0 /100 | #101 | Exceptional 5.0% |
| Immigrants | Kenya | 94.8 /100 | #102 | Exceptional 5.0% |
| Somalis | 94.6 /100 | #103 | Exceptional 5.0% |
Demographics Similar to Immigrants from Jordan by Female Unemployment
In terms of female unemployment, the demographic groups most similar to Immigrants from Jordan are Immigrants from Kazakhstan (5.1%, a difference of 0.030%), Palestinian (5.1%, a difference of 0.040%), Immigrants from Oceania (5.2%, a difference of 0.090%), Immigrants from Norway (5.2%, a difference of 0.10%), and Immigrants from Eastern Europe (5.1%, a difference of 0.11%).
| Demographics | Rating | Rank | Female Unemployment |
| Pakistanis | 83.8 /100 | #137 | Excellent 5.1% |
| Chickasaw | 83.2 /100 | #138 | Excellent 5.1% |
| Immigrants | Eastern Asia | 83.0 /100 | #139 | Excellent 5.1% |
| Immigrants | France | 82.7 /100 | #140 | Excellent 5.1% |
| Immigrants | Eastern Europe | 81.5 /100 | #141 | Excellent 5.1% |
| Palestinians | 80.8 /100 | #142 | Excellent 5.1% |
| Immigrants | Kazakhstan | 80.7 /100 | #143 | Excellent 5.1% |
| Immigrants | Jordan | 80.4 /100 | #144 | Excellent 5.1% |
| Immigrants | Oceania | 79.5 /100 | #145 | Good 5.2% |
| Immigrants | Norway | 79.4 /100 | #146 | Good 5.2% |
| Argentineans | 79.2 /100 | #147 | Good 5.2% |
| Immigrants | Argentina | 78.7 /100 | #148 | Good 5.2% |
| Asians | 78.3 /100 | #149 | Good 5.2% |
| Egyptians | 78.3 /100 | #150 | Good 5.2% |
| Immigrants | China | 75.9 /100 | #151 | Good 5.2% |