Immigrants from South Africa vs Immigrants from Dominican Republic Unemployment
COMPARE
Immigrants from South Africa
Immigrants from Dominican Republic
Unemployment
Unemployment Comparison
Immigrants from South Africa
Immigrants from Dominican Republic
5.0%
UNEMPLOYMENT
96.2/ 100
METRIC RATING
92nd/ 347
METRIC RANK
7.4%
UNEMPLOYMENT
0.0/ 100
METRIC RATING
333rd/ 347
METRIC RANK
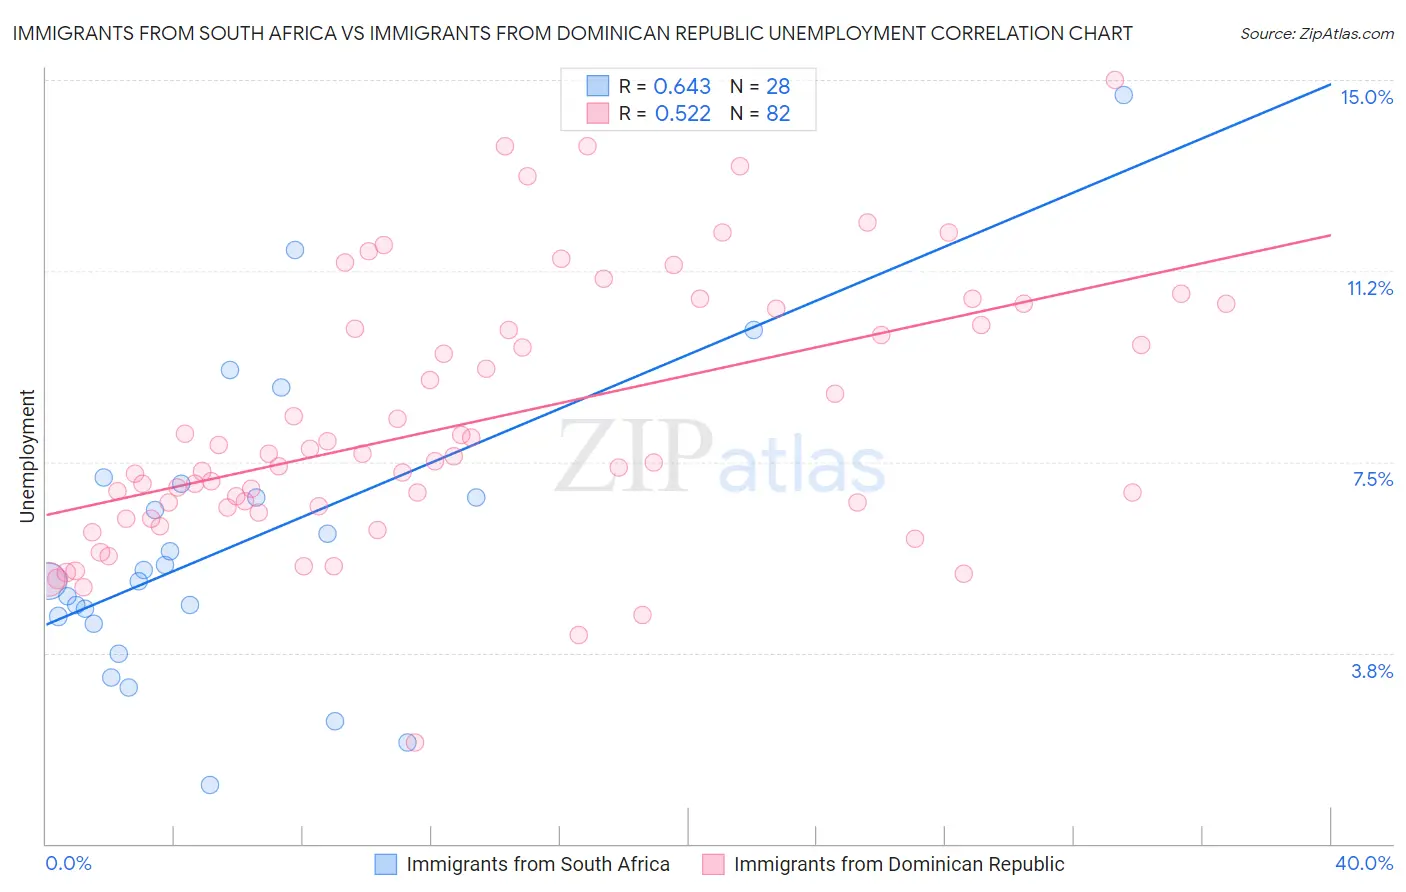
Immigrants from South Africa vs Immigrants from Dominican Republic Unemployment Correlation Chart
The statistical analysis conducted on geographies consisting of 233,181,435 people shows a significant positive correlation between the proportion of Immigrants from South Africa and unemployment in the United States with a correlation coefficient (R) of 0.643 and weighted average of 5.0%. Similarly, the statistical analysis conducted on geographies consisting of 274,892,404 people shows a substantial positive correlation between the proportion of Immigrants from Dominican Republic and unemployment in the United States with a correlation coefficient (R) of 0.522 and weighted average of 7.4%, a difference of 48.0%.
Unemployment Correlation Summary
| Measurement | Immigrants from South Africa | Immigrants from Dominican Republic |
| Minimum | 1.2% | 2.0% |
| Maximum | 14.7% | 15.0% |
| Range | 13.5% | 13.0% |
| Mean | 5.9% | 8.3% |
| Median | 5.3% | 7.6% |
| Interquartile 25% (IQ1) | 4.4% | 6.6% |
| Interquartile 75% (IQ3) | 6.9% | 10.2% |
| Interquartile Range (IQR) | 2.5% | 3.6% |
| Standard Deviation (Sample) | 3.0% | 2.6% |
| Standard Deviation (Population) | 2.9% | 2.5% |
Similar Demographics by Unemployment
Demographics Similar to Immigrants from South Africa by Unemployment
In terms of unemployment, the demographic groups most similar to Immigrants from South Africa are Immigrants from Sudan (5.0%, a difference of 0.020%), Immigrants from North Macedonia (5.0%, a difference of 0.030%), Jordanian (5.0%, a difference of 0.070%), Ukrainian (5.0%, a difference of 0.090%), and Immigrants from Austria (5.0%, a difference of 0.12%).
| Demographics | Rating | Rank | Unemployment |
| Immigrants | Australia | 97.0 /100 | #85 | Exceptional 5.0% |
| Hungarians | 96.9 /100 | #86 | Exceptional 5.0% |
| Immigrants | Moldova | 96.6 /100 | #87 | Exceptional 5.0% |
| Immigrants | Korea | 96.6 /100 | #88 | Exceptional 5.0% |
| Jordanians | 96.4 /100 | #89 | Exceptional 5.0% |
| Immigrants | North Macedonia | 96.3 /100 | #90 | Exceptional 5.0% |
| Immigrants | Sudan | 96.3 /100 | #91 | Exceptional 5.0% |
| Immigrants | South Africa | 96.2 /100 | #92 | Exceptional 5.0% |
| Ukrainians | 96.0 /100 | #93 | Exceptional 5.0% |
| Immigrants | Austria | 95.9 /100 | #94 | Exceptional 5.0% |
| Immigrants | Serbia | 95.6 /100 | #95 | Exceptional 5.0% |
| Immigrants | England | 95.2 /100 | #96 | Exceptional 5.0% |
| Immigrants | Czechoslovakia | 95.1 /100 | #97 | Exceptional 5.0% |
| Romanians | 95.0 /100 | #98 | Exceptional 5.0% |
| Mongolians | 94.8 /100 | #99 | Exceptional 5.0% |
Demographics Similar to Immigrants from Dominican Republic by Unemployment
In terms of unemployment, the demographic groups most similar to Immigrants from Dominican Republic are Sioux (7.4%, a difference of 0.060%), Apache (7.4%, a difference of 0.47%), Dominican (7.4%, a difference of 0.48%), Yakama (7.3%, a difference of 0.82%), and Alaska Native (7.2%, a difference of 2.1%).
| Demographics | Rating | Rank | Unemployment |
| Paiute | 0.0 /100 | #326 | Tragic 7.1% |
| Pueblo | 0.0 /100 | #327 | Tragic 7.2% |
| Tsimshian | 0.0 /100 | #328 | Tragic 7.2% |
| Alaska Natives | 0.0 /100 | #329 | Tragic 7.2% |
| Yakama | 0.0 /100 | #330 | Tragic 7.3% |
| Dominicans | 0.0 /100 | #331 | Tragic 7.4% |
| Sioux | 0.0 /100 | #332 | Tragic 7.4% |
| Immigrants | Dominican Republic | 0.0 /100 | #333 | Tragic 7.4% |
| Apache | 0.0 /100 | #334 | Tragic 7.4% |
| Alaskan Athabascans | 0.0 /100 | #335 | Tragic 7.7% |
| Immigrants | Yemen | 0.0 /100 | #336 | Tragic 7.7% |
| Cheyenne | 0.0 /100 | #337 | Tragic 8.0% |
| Pima | 0.0 /100 | #338 | Tragic 8.2% |
| Navajo | 0.0 /100 | #339 | Tragic 8.4% |
| Puerto Ricans | 0.0 /100 | #340 | Tragic 8.4% |