Immigrants from Northern Europe vs Immigrants from Dominican Republic Unemployment

COMPARE

Immigrants from Northern Europe
Race
Ancestry
AfghanAfricanAlaska NativeAlaskan AthabascanAlbanianAleutAlsatianAmericanApacheArabArapahoArgentineanArmenianAssyrian/Chaldean/SyriacAustralianAustrianBahamianBangladeshiBarbadianBasqueBelgianBelizeanBermudanBhutaneseBlackfeetBolivianBrazilianBritishBritish West IndianBulgarianBurmeseCajunCambodianCanadianCape VerdeanCarpatho RusynCelticCentral AmericanCentral American IndianCherokeeCheyenneChickasawChileanChineseChippewaChoctawColombianColvilleComancheCosta RicanCreeCreekCroatianCrowCubanCypriotCzechCzechoslovakianDanishDelawareDominicanDutchDutch West IndianEastern EuropeanEcuadorianEgyptianEnglishEstonianEthiopianEuropeanFijianFilipinoFinnishFrenchFrench American IndianFrench CanadianGermanGerman RussianGhanaianGreekGuamanian/ChamorroGuatemalanGuyaneseHaitianHmongHonduranHopiHoumaHungarianIcelanderIndian (Asian)IndonesianInupiatIranianIraqiIrishIroquoisIsraeliItalianJamaicanJapaneseJordanianKenyanKiowaKoreanLaotianLatvianLebaneseLiberianLithuanianLumbeeLuxembourgerMacedonianMalaysianMalteseMarshalleseMenomineeMexicanMexican American IndianMongolianMoroccanNative HawaiianNavajoNepaleseNew ZealanderNicaraguanNigerianNorthern EuropeanNorwegianOkinawanOsageOttawaPaiutePakistaniPalestinianPanamanianParaguayanPennsylvania GermanPeruvianPimaPolishPortuguesePotawatomiPuebloPuerto RicanPuget Sound SalishRomanianRussianSalvadoranSamoanScandinavianScotch-IrishScottishSeminoleSenegaleseSerbianShoshoneSierra LeoneanSiouxSlavicSlovakSloveneSomaliSouth AfricanSouth AmericanSouth American IndianSoviet UnionSpaniardSpanishSpanish AmericanSpanish American IndianSri LankanSubsaharan AfricanSudaneseSwedishSwissSyrianTaiwaneseThaiTlingit-HaidaTohono O'OdhamTonganTrinidadian and TobagonianTsimshianTurkishU.S. Virgin IslanderUgandanUkrainianUruguayanUteVenezuelanVietnameseWelshWest IndianYakamaYaquiYugoslavianYumanYup'ikZimbabwean
Immigration
NonimmigrantsImmigrantsAfghanistanAfricaAlbaniaArgentinaArmeniaAsiaAustraliaAustriaBahamasBangladeshBarbadosBelarusBelgiumBelizeBoliviaBosnia and HerzegovinaBrazilBulgariaBurma/MyanmarCabo VerdeCambodiaCameroonCanadaCaribbeanCentral AmericaChileChinaColombiaCongoCosta RicaCroatiaCubaCzechoslovakiaDenmarkDominicaEastern AfricaEastern AsiaEastern EuropeEcuadorEgyptEl SalvadorEnglandEritreaEthiopiaEuropeFijiFranceGermanyGhanaGreeceGrenadaGuatemalaGuyanaHaitiHondurasHong KongHungaryIndiaIndonesiaIranIraqIrelandIsraelItalyJamaicaJapanJordanKazakhstanKenyaKoreaKuwaitLaosLatin AmericaLatviaLebanonLiberiaLithuaniaMalaysiaMexicoMicronesiaMiddle AfricaMoldovaMoroccoNepalNetherlandsNicaraguaNigeriaNorth AmericaNorth MacedoniaNorthern AfricaNorthern EuropeNorwayOceaniaPakistanPanamaPeruPhilippinesPolandPortugalRomaniaRussiaSaudi ArabiaScotlandSenegalSerbiaSierra LeoneSingaporeSomaliaSouth AfricaSouth AmericaSouth Central AsiaSouth Eastern AsiaSouthern EuropeSpainSri LankaSt. Vincent and the GrenadinesSudanSwedenSwitzerlandSyriaTaiwanThailandTrinidad and TobagoTurkeyUgandaUkraineUruguayUzbekistanVenezuelaVietnamWest IndiesWestern AfricaWestern AsiaWestern EuropeYemenZaireZimbabweAzores
Immigrants from Dominican Republic
Race
Ancestry
AfghanAfricanAlaska NativeAlaskan AthabascanAlbanianAleutAlsatianAmericanApacheArabArapahoArgentineanArmenianAssyrian/Chaldean/SyriacAustralianAustrianBahamianBangladeshiBarbadianBasqueBelgianBelizeanBermudanBhutaneseBlackfeetBolivianBrazilianBritishBritish West IndianBulgarianBurmeseCajunCambodianCanadianCape VerdeanCarpatho RusynCelticCentral AmericanCentral American IndianCherokeeCheyenneChickasawChileanChineseChippewaChoctawColombianColvilleComancheCosta RicanCreeCreekCroatianCrowCubanCypriotCzechCzechoslovakianDanishDelawareDominicanDutchDutch West IndianEastern EuropeanEcuadorianEgyptianEnglishEstonianEthiopianEuropeanFijianFilipinoFinnishFrenchFrench American IndianFrench CanadianGermanGerman RussianGhanaianGreekGuamanian/ChamorroGuatemalanGuyaneseHaitianHmongHonduranHopiHoumaHungarianIcelanderIndian (Asian)IndonesianInupiatIranianIraqiIrishIroquoisIsraeliItalianJamaicanJapaneseJordanianKenyanKiowaKoreanLaotianLatvianLebaneseLiberianLithuanianLumbeeLuxembourgerMacedonianMalaysianMalteseMarshalleseMenomineeMexicanMexican American IndianMongolianMoroccanNative HawaiianNavajoNepaleseNew ZealanderNicaraguanNigerianNorthern EuropeanNorwegianOkinawanOsageOttawaPaiutePakistaniPalestinianPanamanianParaguayanPennsylvania GermanPeruvianPimaPolishPortuguesePotawatomiPuebloPuerto RicanPuget Sound SalishRomanianRussianSalvadoranSamoanScandinavianScotch-IrishScottishSeminoleSenegaleseSerbianShoshoneSierra LeoneanSiouxSlavicSlovakSloveneSomaliSouth AfricanSouth AmericanSouth American IndianSoviet UnionSpaniardSpanishSpanish AmericanSpanish American IndianSri LankanSubsaharan AfricanSudaneseSwedishSwissSyrianTaiwaneseThaiTlingit-HaidaTohono O'OdhamTonganTrinidadian and TobagonianTsimshianTurkishU.S. Virgin IslanderUgandanUkrainianUruguayanUteVenezuelanVietnameseWelshWest IndianYakamaYaquiYugoslavianYumanYup'ikZimbabwean
Immigration
NonimmigrantsImmigrantsAfghanistanAfricaAlbaniaArgentinaArmeniaAsiaAustraliaAustriaBahamasBangladeshBarbadosBelarusBelgiumBelizeBoliviaBosnia and HerzegovinaBrazilBulgariaBurma/MyanmarCabo VerdeCambodiaCameroonCanadaCaribbeanCentral AmericaChileChinaColombiaCongoCosta RicaCroatiaCubaCzechoslovakiaDenmarkDominicaDominican RepublicEastern AfricaEastern AsiaEastern EuropeEcuadorEgyptEl SalvadorEnglandEritreaEthiopiaEuropeFijiFranceGermanyGhanaGreeceGrenadaGuatemalaGuyanaHaitiHondurasHong KongHungaryIndiaIndonesiaIranIraqIrelandIsraelItalyJamaicaJapanJordanKazakhstanKenyaKoreaKuwaitLaosLatin AmericaLatviaLebanonLiberiaLithuaniaMalaysiaMexicoMicronesiaMiddle AfricaMoldovaMoroccoNepalNetherlandsNicaraguaNigeriaNorth AmericaNorth MacedoniaNorthern AfricaNorwayOceaniaPakistanPanamaPeruPhilippinesPolandPortugalRomaniaRussiaSaudi ArabiaScotlandSenegalSerbiaSierra LeoneSingaporeSomaliaSouth AfricaSouth AmericaSouth Central AsiaSouth Eastern AsiaSouthern EuropeSpainSri LankaSt. Vincent and the GrenadinesSudanSwedenSwitzerlandSyriaTaiwanThailandTrinidad and TobagoTurkeyUgandaUkraineUruguayUzbekistanVenezuelaVietnamWest IndiesWestern AfricaWestern AsiaWestern EuropeYemenZaireZimbabweAzores
Unemployment
Income
Poverty
Unemployment
Labor Participation
Family Structure
Vehicle Availability
Education Level
Disability

Unemployment Comparison

Immigrants from Northern Europe

Immigrants from Dominican Republic

Exceptional
Tragic
4.9%
UNEMPLOYMENT
98.2/ 100
METRIC RATING
74th/ 347
METRIC RANK
7.4%
UNEMPLOYMENT
0.0/ 100
METRIC RATING
333rd/ 347
METRIC RANK

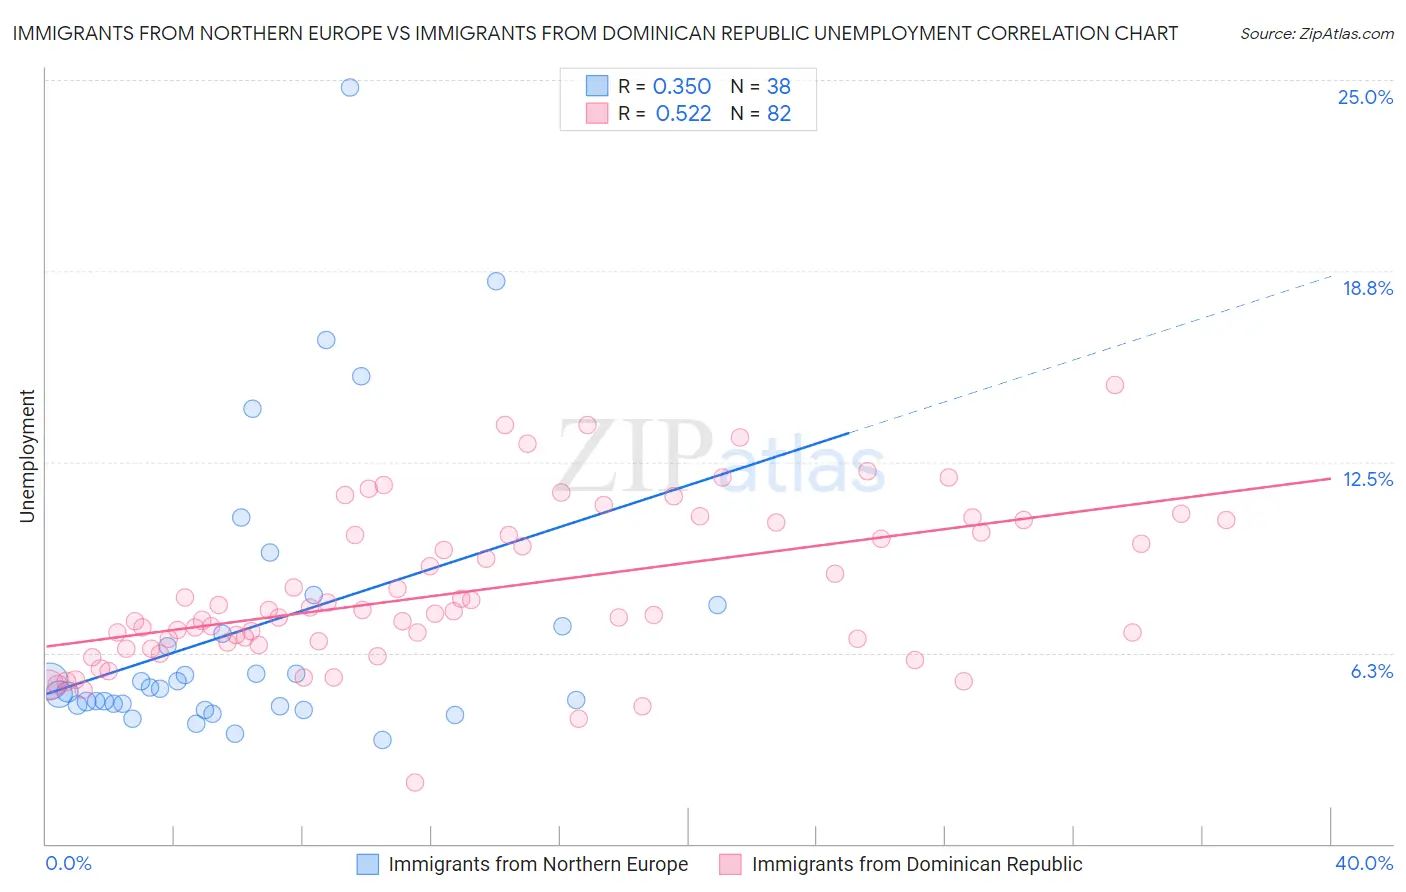
Immigrants from Northern Europe vs Immigrants from Dominican Republic Unemployment Correlation Chart

The statistical analysis conducted on geographies consisting of 476,230,323 people shows a mild positive correlation between the proportion of Immigrants from Northern Europe and unemployment in the United States with a correlation coefficient (R) of 0.350 and weighted average of 4.9%. Similarly, the statistical analysis conducted on geographies consisting of 274,892,404 people shows a substantial positive correlation between the proportion of Immigrants from Dominican Republic and unemployment in the United States with a correlation coefficient (R) of 0.522 and weighted average of 7.4%, a difference of 49.8%.
Immigrants from Northern Europe vs Immigrants from Dominican Republic Unemployment

Unemployment Correlation Summary

MeasurementImmigrants from Northern EuropeImmigrants from Dominican Republic
Minimum3.4%2.0%
Maximum24.8%15.0%
Range21.4%13.0%
Mean7.0%8.3%
Median5.1%7.6%
Interquartile 25% (IQ1)4.5%6.6%
Interquartile 75% (IQ3)7.1%10.2%
Interquartile Range (IQR)2.6%3.6%
Standard Deviation (Sample)4.7%2.6%
Standard Deviation (Population)4.7%2.5%

Similar Demographics by Unemployment

Demographics Similar to Immigrants from Northern Europe by Unemployment

In terms of unemployment, the demographic groups most similar to Immigrants from Northern Europe are Paraguayan (4.9%, a difference of 0.090%), Turkish (4.9%, a difference of 0.13%), Burmese (4.9%, a difference of 0.14%), Immigrants from Japan (4.9%, a difference of 0.16%), and German Russian (4.9%, a difference of 0.16%).
DemographicsRating | RankUnemployment
New Zealanders
98.6
/100
|
#67
Exceptional
4.9%
Slavs
98.6
/100
|
#68
Exceptional
4.9%
Immigrants | North America
98.5
/100
|
#69
Exceptional
4.9%
Serbians
98.4
/100
|
#70
Exceptional
4.9%
Immigrants | Japan
98.3
/100
|
#71
Exceptional
4.9%
Burmese
98.3
/100
|
#72
Exceptional
4.9%
Paraguayans
98.3
/100
|
#73
Exceptional
4.9%
Immigrants | Northern Europe
98.2
/100
|
#74
Exceptional
4.9%
Turks
98.0
/100
|
#75
Exceptional
4.9%
German Russians
98.0
/100
|
#76
Exceptional
4.9%
Cypriots
97.9
/100
|
#77
Exceptional
4.9%
Okinawans
97.9
/100
|
#78
Exceptional
4.9%
Canadians
97.7
/100
|
#79
Exceptional
5.0%
Immigrants | Sweden
97.6
/100
|
#80
Exceptional
5.0%
Basques
97.6
/100
|
#81
Exceptional
5.0%

Demographics Similar to Immigrants from Dominican Republic by Unemployment

In terms of unemployment, the demographic groups most similar to Immigrants from Dominican Republic are Sioux (7.4%, a difference of 0.060%), Apache (7.4%, a difference of 0.47%), Dominican (7.4%, a difference of 0.48%), Yakama (7.3%, a difference of 0.82%), and Alaska Native (7.2%, a difference of 2.1%).
DemographicsRating | RankUnemployment
Paiute
0.0
/100
|
#326
Tragic
7.1%
Pueblo
0.0
/100
|
#327
Tragic
7.2%
Tsimshian
0.0
/100
|
#328
Tragic
7.2%
Alaska Natives
0.0
/100
|
#329
Tragic
7.2%
Yakama
0.0
/100
|
#330
Tragic
7.3%
Dominicans
0.0
/100
|
#331
Tragic
7.4%
Sioux
0.0
/100
|
#332
Tragic
7.4%
Immigrants | Dominican Republic
0.0
/100
|
#333
Tragic
7.4%
Apache
0.0
/100
|
#334
Tragic
7.4%
Alaskan Athabascans
0.0
/100
|
#335
Tragic
7.7%
Immigrants | Yemen
0.0
/100
|
#336
Tragic
7.7%
Cheyenne
0.0
/100
|
#337
Tragic
8.0%
Pima
0.0
/100
|
#338
Tragic
8.2%
Navajo
0.0
/100
|
#339
Tragic
8.4%
Puerto Ricans
0.0
/100
|
#340
Tragic
8.4%