Immigrants from Scotland vs Immigrants from Oceania Unemployment Among Women with Children Under 6 years
COMPARE
Immigrants from Scotland
Immigrants from Oceania
Unemployment Among Women with Children Under 6 years
Unemployment Among Women with Children Under 6 years Comparison
Immigrants from Scotland
Immigrants from Oceania
7.6%
UNEMPLOYMENT AMONG WOMEN WITH CHILDREN UNDER 6 YEARS
61.3/ 100
METRIC RATING
169th/ 347
METRIC RANK
7.5%
UNEMPLOYMENT AMONG WOMEN WITH CHILDREN UNDER 6 YEARS
78.4/ 100
METRIC RATING
147th/ 347
METRIC RANK
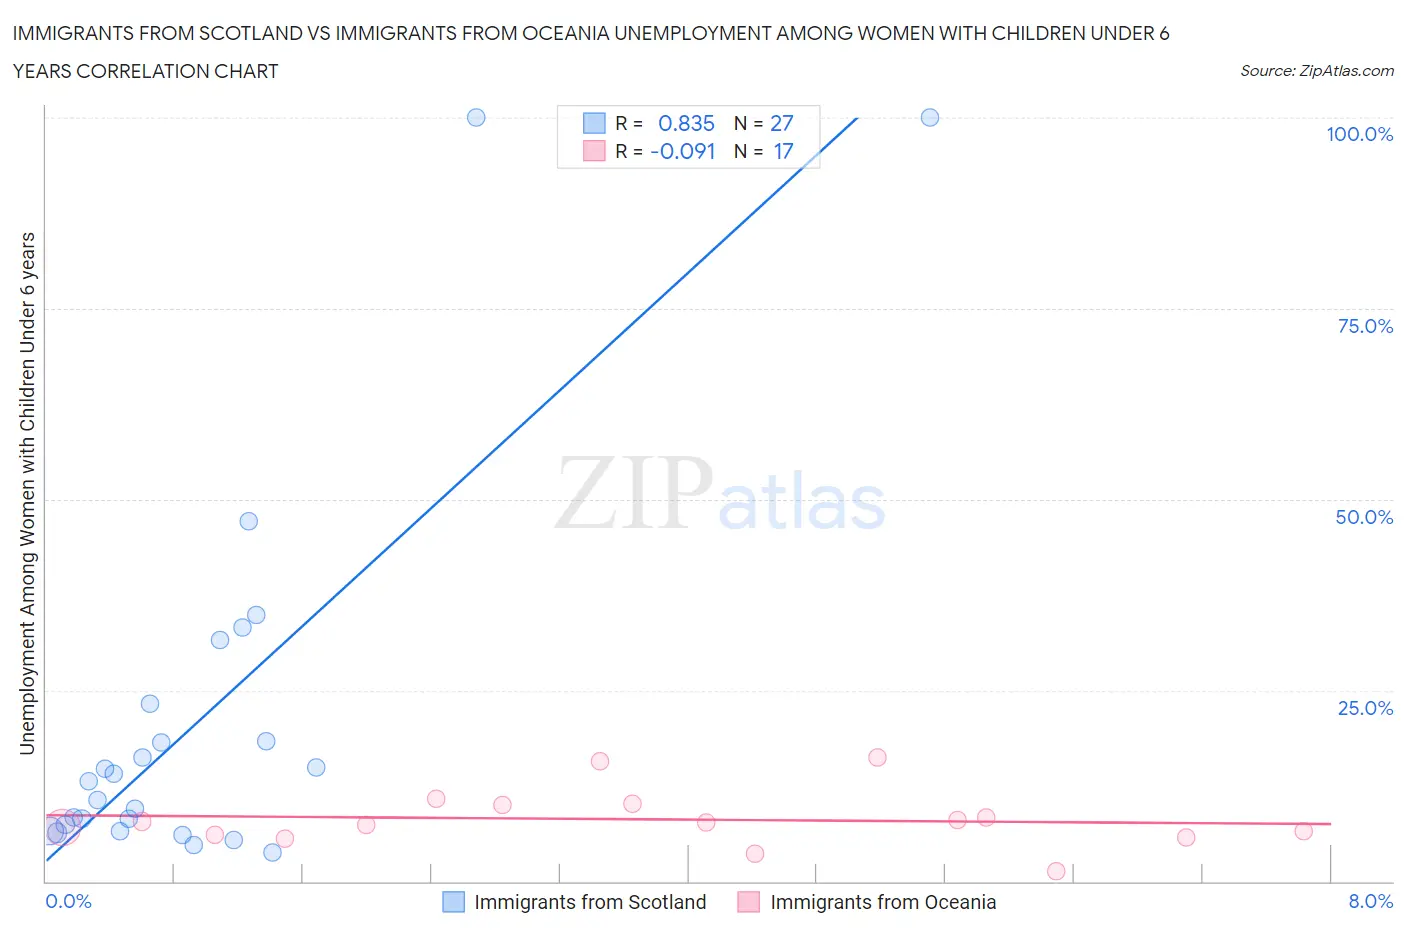
Immigrants from Scotland vs Immigrants from Oceania Unemployment Among Women with Children Under 6 years Correlation Chart
The statistical analysis conducted on geographies consisting of 161,734,775 people shows a very strong positive correlation between the proportion of Immigrants from Scotland and unemployment rate among women with children under the age of 6 in the United States with a correlation coefficient (R) of 0.835 and weighted average of 7.6%. Similarly, the statistical analysis conducted on geographies consisting of 243,645,085 people shows a slight negative correlation between the proportion of Immigrants from Oceania and unemployment rate among women with children under the age of 6 in the United States with a correlation coefficient (R) of -0.091 and weighted average of 7.5%, a difference of 1.4%.
Unemployment Among Women with Children Under 6 years Correlation Summary
| Measurement | Immigrants from Scotland | Immigrants from Oceania |
| Minimum | 3.7% | 1.3% |
| Maximum | 100.0% | 16.3% |
| Range | 96.3% | 15.0% |
| Mean | 21.2% | 8.1% |
| Median | 13.1% | 7.6% |
| Interquartile 25% (IQ1) | 6.6% | 5.9% |
| Interquartile 75% (IQ3) | 23.2% | 10.1% |
| Interquartile Range (IQR) | 16.6% | 4.2% |
| Standard Deviation (Sample) | 25.1% | 3.8% |
| Standard Deviation (Population) | 24.7% | 3.7% |
Similar Demographics by Unemployment Among Women with Children Under 6 years
Demographics Similar to Immigrants from Scotland by Unemployment Among Women with Children Under 6 years
In terms of unemployment among women with children under 6 years, the demographic groups most similar to Immigrants from Scotland are Immigrants from Canada (7.6%, a difference of 0.020%), Kenyan (7.6%, a difference of 0.080%), Czech (7.6%, a difference of 0.11%), Belgian (7.6%, a difference of 0.15%), and Immigrants from Grenada (7.6%, a difference of 0.16%).
| Demographics | Rating | Rank | Unemployment Among Women with Children Under 6 years |
| Immigrants | Lithuania | 68.8 /100 | #162 | Good 7.5% |
| British | 66.3 /100 | #163 | Good 7.6% |
| Ugandans | 65.8 /100 | #164 | Good 7.6% |
| Immigrants | South America | 65.6 /100 | #165 | Good 7.6% |
| Belgians | 63.5 /100 | #166 | Good 7.6% |
| Kenyans | 62.5 /100 | #167 | Good 7.6% |
| Immigrants | Canada | 61.6 /100 | #168 | Good 7.6% |
| Immigrants | Scotland | 61.3 /100 | #169 | Good 7.6% |
| Czechs | 59.8 /100 | #170 | Average 7.6% |
| Immigrants | Grenada | 59.0 /100 | #171 | Average 7.6% |
| Immigrants | North America | 57.7 /100 | #172 | Average 7.6% |
| Cree | 51.6 /100 | #173 | Average 7.6% |
| Immigrants | Laos | 50.0 /100 | #174 | Average 7.6% |
| Panamanians | 49.6 /100 | #175 | Average 7.6% |
| Puget Sound Salish | 47.7 /100 | #176 | Average 7.7% |
Demographics Similar to Immigrants from Oceania by Unemployment Among Women with Children Under 6 years
In terms of unemployment among women with children under 6 years, the demographic groups most similar to Immigrants from Oceania are Immigrants from Jordan (7.5%, a difference of 0.050%), Japanese (7.5%, a difference of 0.050%), European (7.5%, a difference of 0.070%), Immigrants from Brazil (7.5%, a difference of 0.11%), and Colombian (7.5%, a difference of 0.22%).
| Demographics | Rating | Rank | Unemployment Among Women with Children Under 6 years |
| Scandinavians | 83.0 /100 | #140 | Excellent 7.4% |
| Greeks | 82.6 /100 | #141 | Excellent 7.4% |
| Immigrants | Argentina | 81.5 /100 | #142 | Excellent 7.5% |
| Koreans | 81.3 /100 | #143 | Excellent 7.5% |
| Europeans | 79.1 /100 | #144 | Good 7.5% |
| Immigrants | Jordan | 78.9 /100 | #145 | Good 7.5% |
| Japanese | 78.9 /100 | #146 | Good 7.5% |
| Immigrants | Oceania | 78.4 /100 | #147 | Good 7.5% |
| Immigrants | Brazil | 77.3 /100 | #148 | Good 7.5% |
| Colombians | 76.1 /100 | #149 | Good 7.5% |
| Aleuts | 76.0 /100 | #150 | Good 7.5% |
| Immigrants | Peru | 74.9 /100 | #151 | Good 7.5% |
| Bangladeshis | 74.8 /100 | #152 | Good 7.5% |
| Uruguayans | 74.7 /100 | #153 | Good 7.5% |
| Northern Europeans | 74.3 /100 | #154 | Good 7.5% |