Chilean vs Immigrants from Oceania Unemployment Among Women with Children Under 6 years

COMPARE

Chilean
Race
Ancestry
AfghanAfricanAlaska NativeAlaskan AthabascanAlbanianAleutAlsatianAmericanApacheArabArapahoArgentineanArmenianAssyrian/Chaldean/SyriacAustralianAustrianBahamianBangladeshiBarbadianBasqueBelgianBelizeanBermudanBhutaneseBlackfeetBolivianBrazilianBritishBritish West IndianBulgarianBurmeseCajunCambodianCanadianCape VerdeanCarpatho RusynCelticCentral AmericanCentral American IndianCherokeeCheyenneChickasawChileanChineseChippewaChoctawColombianColvilleComancheCosta RicanCreeCreekCroatianCrowCubanCypriotCzechCzechoslovakianDanishDelawareDominicanDutchDutch West IndianEastern EuropeanEcuadorianEgyptianEnglishEstonianEthiopianEuropeanFijianFilipinoFinnishFrenchFrench American IndianFrench CanadianGermanGerman RussianGhanaianGreekGuamanian/ChamorroGuatemalanGuyaneseHaitianHmongHonduranHopiHoumaHungarianIcelanderIndian (Asian)IndonesianInupiatIranianIraqiIrishIroquoisIsraeliItalianJamaicanJapaneseJordanianKenyanKiowaKoreanLaotianLatvianLebaneseLiberianLithuanianLumbeeLuxembourgerMacedonianMalaysianMalteseMarshalleseMenomineeMexicanMexican American IndianMongolianMoroccanNative HawaiianNavajoNepaleseNew ZealanderNicaraguanNigerianNorthern EuropeanNorwegianOkinawanOsageOttawaPaiutePakistaniPalestinianPanamanianParaguayanPennsylvania GermanPeruvianPimaPolishPortuguesePotawatomiPuebloPuerto RicanPuget Sound SalishRomanianRussianSalvadoranSamoanScandinavianScotch-IrishScottishSeminoleSenegaleseSerbianShoshoneSierra LeoneanSiouxSlavicSlovakSloveneSomaliSouth AfricanSouth AmericanSouth American IndianSoviet UnionSpaniardSpanishSpanish AmericanSpanish American IndianSri LankanSubsaharan AfricanSudaneseSwedishSwissSyrianTaiwaneseThaiTlingit-HaidaTohono O'OdhamTonganTrinidadian and TobagonianTsimshianTurkishU.S. Virgin IslanderUgandanUkrainianUruguayanUteVenezuelanVietnameseWelshWest IndianYakamaYaquiYugoslavianYumanYup'ikZimbabwean
Immigration
NonimmigrantsImmigrantsAfghanistanAfricaAlbaniaArgentinaArmeniaAsiaAustraliaAustriaBahamasBangladeshBarbadosBelarusBelgiumBelizeBoliviaBosnia and HerzegovinaBrazilBulgariaBurma/MyanmarCabo VerdeCambodiaCameroonCanadaCaribbeanCentral AmericaChileChinaColombiaCongoCosta RicaCroatiaCubaCzechoslovakiaDenmarkDominicaDominican RepublicEastern AfricaEastern AsiaEastern EuropeEcuadorEgyptEl SalvadorEnglandEritreaEthiopiaEuropeFijiFranceGermanyGhanaGreeceGrenadaGuatemalaGuyanaHaitiHondurasHong KongHungaryIndiaIndonesiaIranIraqIrelandIsraelItalyJamaicaJapanJordanKazakhstanKenyaKoreaKuwaitLaosLatin AmericaLatviaLebanonLiberiaLithuaniaMalaysiaMexicoMicronesiaMiddle AfricaMoldovaMoroccoNepalNetherlandsNicaraguaNigeriaNorth AmericaNorth MacedoniaNorthern AfricaNorthern EuropeNorwayPakistanPanamaPeruPhilippinesPolandPortugalRomaniaRussiaSaudi ArabiaScotlandSenegalSerbiaSierra LeoneSingaporeSomaliaSouth AfricaSouth AmericaSouth Central AsiaSouth Eastern AsiaSouthern EuropeSpainSri LankaSt. Vincent and the GrenadinesSudanSwedenSwitzerlandSyriaTaiwanThailandTrinidad and TobagoTurkeyUgandaUkraineUruguayUzbekistanVenezuelaVietnamWest IndiesWestern AfricaWestern AsiaWestern EuropeYemenZaireZimbabweAzores
Immigrants from Oceania
Race
Ancestry
AfghanAfricanAlaska NativeAlaskan AthabascanAlbanianAleutAlsatianAmericanApacheArabArapahoArgentineanArmenianAssyrian/Chaldean/SyriacAustralianAustrianBahamianBangladeshiBarbadianBasqueBelgianBelizeanBermudanBhutaneseBlackfeetBolivianBrazilianBritishBritish West IndianBulgarianBurmeseCajunCambodianCanadianCape VerdeanCarpatho RusynCelticCentral AmericanCentral American IndianCherokeeCheyenneChickasawChineseChippewaChoctawColombianColvilleComancheCosta RicanCreeCreekCroatianCrowCubanCypriotCzechCzechoslovakianDanishDelawareDominicanDutchDutch West IndianEastern EuropeanEcuadorianEgyptianEnglishEstonianEthiopianEuropeanFijianFilipinoFinnishFrenchFrench American IndianFrench CanadianGermanGerman RussianGhanaianGreekGuamanian/ChamorroGuatemalanGuyaneseHaitianHmongHonduranHopiHoumaHungarianIcelanderIndian (Asian)IndonesianInupiatIranianIraqiIrishIroquoisIsraeliItalianJamaicanJapaneseJordanianKenyanKiowaKoreanLaotianLatvianLebaneseLiberianLithuanianLumbeeLuxembourgerMacedonianMalaysianMalteseMarshalleseMenomineeMexicanMexican American IndianMongolianMoroccanNative HawaiianNavajoNepaleseNew ZealanderNicaraguanNigerianNorthern EuropeanNorwegianOkinawanOsageOttawaPaiutePakistaniPalestinianPanamanianParaguayanPennsylvania GermanPeruvianPimaPolishPortuguesePotawatomiPuebloPuerto RicanPuget Sound SalishRomanianRussianSalvadoranSamoanScandinavianScotch-IrishScottishSeminoleSenegaleseSerbianShoshoneSierra LeoneanSiouxSlavicSlovakSloveneSomaliSouth AfricanSouth AmericanSouth American IndianSoviet UnionSpaniardSpanishSpanish AmericanSpanish American IndianSri LankanSubsaharan AfricanSudaneseSwedishSwissSyrianTaiwaneseThaiTlingit-HaidaTohono O'OdhamTonganTrinidadian and TobagonianTsimshianTurkishU.S. Virgin IslanderUgandanUkrainianUruguayanUteVenezuelanVietnameseWelshWest IndianYakamaYaquiYugoslavianYumanYup'ikZimbabwean
Immigration
NonimmigrantsImmigrantsAfghanistanAfricaAlbaniaArgentinaArmeniaAsiaAustraliaAustriaBahamasBangladeshBarbadosBelarusBelgiumBelizeBoliviaBosnia and HerzegovinaBrazilBulgariaBurma/MyanmarCabo VerdeCambodiaCameroonCanadaCaribbeanCentral AmericaChileChinaColombiaCongoCosta RicaCroatiaCubaCzechoslovakiaDenmarkDominicaDominican RepublicEastern AfricaEastern AsiaEastern EuropeEcuadorEgyptEl SalvadorEnglandEritreaEthiopiaEuropeFijiFranceGermanyGhanaGreeceGrenadaGuatemalaGuyanaHaitiHondurasHong KongHungaryIndiaIndonesiaIranIraqIrelandIsraelItalyJamaicaJapanJordanKazakhstanKenyaKoreaKuwaitLaosLatin AmericaLatviaLebanonLiberiaLithuaniaMalaysiaMexicoMicronesiaMiddle AfricaMoldovaMoroccoNepalNetherlandsNicaraguaNigeriaNorth AmericaNorth MacedoniaNorthern AfricaNorthern EuropeNorwayOceaniaPakistanPanamaPeruPhilippinesPolandPortugalRomaniaRussiaSaudi ArabiaScotlandSenegalSerbiaSierra LeoneSingaporeSomaliaSouth AfricaSouth AmericaSouth Central AsiaSouth Eastern AsiaSouthern EuropeSpainSri LankaSt. Vincent and the GrenadinesSudanSwedenSwitzerlandSyriaTaiwanThailandTrinidad and TobagoTurkeyUgandaUkraineUruguayUzbekistanVenezuelaVietnamWest IndiesWestern AfricaWestern AsiaWestern EuropeYemenZaireZimbabweAzores
Unemployment Among Women with Children Under 6 years
Income
Poverty
Unemployment
Labor Participation
Family Structure
Vehicle Availability
Education Level
Disability

Unemployment Among Women with Children Under 6 years Comparison

Chileans

Immigrants from Oceania

Exceptional
Good
7.2%
UNEMPLOYMENT AMONG WOMEN WITH CHILDREN UNDER 6 YEARS
97.4/ 100
METRIC RATING
101st/ 347
METRIC RANK
7.5%
UNEMPLOYMENT AMONG WOMEN WITH CHILDREN UNDER 6 YEARS
78.4/ 100
METRIC RATING
147th/ 347
METRIC RANK

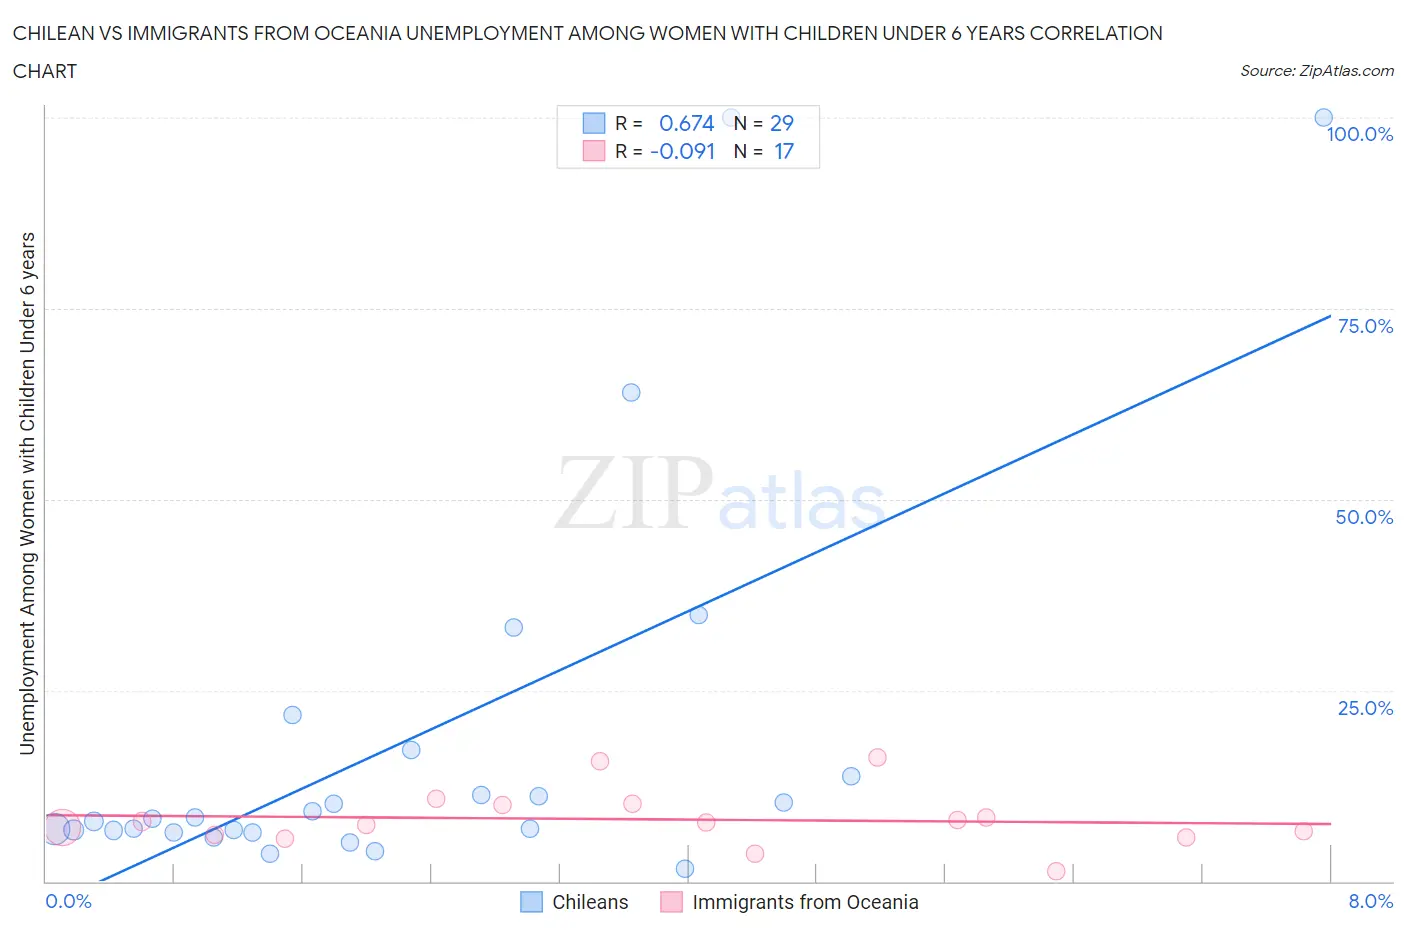
Chilean vs Immigrants from Oceania Unemployment Among Women with Children Under 6 years Correlation Chart

The statistical analysis conducted on geographies consisting of 212,235,383 people shows a significant positive correlation between the proportion of Chileans and unemployment rate among women with children under the age of 6 in the United States with a correlation coefficient (R) of 0.674 and weighted average of 7.2%. Similarly, the statistical analysis conducted on geographies consisting of 243,645,085 people shows a slight negative correlation between the proportion of Immigrants from Oceania and unemployment rate among women with children under the age of 6 in the United States with a correlation coefficient (R) of -0.091 and weighted average of 7.5%, a difference of 4.1%.
Chilean vs Immigrants from Oceania Unemployment Among Women with Children Under 6 years

Unemployment Among Women with Children Under 6 years Correlation Summary

MeasurementChileanImmigrants from Oceania
Minimum1.6%1.3%
Maximum100.0%16.3%
Range98.4%15.0%
Mean18.4%8.1%
Median8.2%7.6%
Interquartile 25% (IQ1)6.5%5.9%
Interquartile 75% (IQ3)15.5%10.1%
Interquartile Range (IQR)9.0%4.2%
Standard Deviation (Sample)25.8%3.8%
Standard Deviation (Population)25.4%3.7%

Similar Demographics by Unemployment Among Women with Children Under 6 years

Demographics Similar to Chileans by Unemployment Among Women with Children Under 6 years

In terms of unemployment among women with children under 6 years, the demographic groups most similar to Chileans are Immigrants from Northern Europe (7.2%, a difference of 0.020%), Immigrants from Nicaragua (7.2%, a difference of 0.030%), Immigrants from Saudi Arabia (7.2%, a difference of 0.030%), Immigrants from Europe (7.2%, a difference of 0.070%), and Russian (7.2%, a difference of 0.11%).
DemographicsRating | RankUnemployment Among Women with Children Under 6 years
Macedonians
97.7
/100
|
#94
Exceptional
7.2%
Romanians
97.7
/100
|
#95
Exceptional
7.2%
Immigrants | Eastern Africa
97.7
/100
|
#96
Exceptional
7.2%
Immigrants | South Eastern Asia
97.6
/100
|
#97
Exceptional
7.2%
Russians
97.5
/100
|
#98
Exceptional
7.2%
Immigrants | Europe
97.5
/100
|
#99
Exceptional
7.2%
Immigrants | Northern Europe
97.4
/100
|
#100
Exceptional
7.2%
Chileans
97.4
/100
|
#101
Exceptional
7.2%
Immigrants | Nicaragua
97.3
/100
|
#102
Exceptional
7.2%
Immigrants | Saudi Arabia
97.3
/100
|
#103
Exceptional
7.2%
Immigrants | Egypt
97.2
/100
|
#104
Exceptional
7.2%
Venezuelans
97.2
/100
|
#105
Exceptional
7.2%
Immigrants | Pakistan
97.2
/100
|
#106
Exceptional
7.2%
Immigrants | Kazakhstan
97.1
/100
|
#107
Exceptional
7.2%
Eastern Europeans
96.9
/100
|
#108
Exceptional
7.2%

Demographics Similar to Immigrants from Oceania by Unemployment Among Women with Children Under 6 years

In terms of unemployment among women with children under 6 years, the demographic groups most similar to Immigrants from Oceania are Immigrants from Jordan (7.5%, a difference of 0.050%), Japanese (7.5%, a difference of 0.050%), European (7.5%, a difference of 0.070%), Immigrants from Brazil (7.5%, a difference of 0.11%), and Colombian (7.5%, a difference of 0.22%).
DemographicsRating | RankUnemployment Among Women with Children Under 6 years
Scandinavians
83.0
/100
|
#140
Excellent
7.4%
Greeks
82.6
/100
|
#141
Excellent
7.4%
Immigrants | Argentina
81.5
/100
|
#142
Excellent
7.5%
Koreans
81.3
/100
|
#143
Excellent
7.5%
Europeans
79.1
/100
|
#144
Good
7.5%
Immigrants | Jordan
78.9
/100
|
#145
Good
7.5%
Japanese
78.9
/100
|
#146
Good
7.5%
Immigrants | Oceania
78.4
/100
|
#147
Good
7.5%
Immigrants | Brazil
77.3
/100
|
#148
Good
7.5%
Colombians
76.1
/100
|
#149
Good
7.5%
Aleuts
76.0
/100
|
#150
Good
7.5%
Immigrants | Peru
74.9
/100
|
#151
Good
7.5%
Bangladeshis
74.8
/100
|
#152
Good
7.5%
Uruguayans
74.7
/100
|
#153
Good
7.5%
Northern Europeans
74.3
/100
|
#154
Good
7.5%