Immigrants from Russia vs Malaysian Unemployment Among Ages 65 to 74 years

COMPARE

Immigrants from Russia
Race
Ancestry
AfghanAfricanAlaska NativeAlaskan AthabascanAlbanianAleutAlsatianAmericanApacheArabArapahoArgentineanArmenianAssyrian/Chaldean/SyriacAustralianAustrianBahamianBangladeshiBarbadianBasqueBelgianBelizeanBermudanBhutaneseBlackfeetBolivianBrazilianBritishBritish West IndianBulgarianBurmeseCajunCambodianCanadianCape VerdeanCarpatho RusynCelticCentral AmericanCentral American IndianCherokeeCheyenneChickasawChileanChineseChippewaChoctawColombianColvilleComancheCosta RicanCreeCreekCroatianCrowCubanCypriotCzechCzechoslovakianDanishDelawareDominicanDutchDutch West IndianEastern EuropeanEcuadorianEgyptianEnglishEstonianEthiopianEuropeanFijianFilipinoFinnishFrenchFrench American IndianFrench CanadianGermanGerman RussianGhanaianGreekGuamanian/ChamorroGuatemalanGuyaneseHaitianHmongHonduranHopiHoumaHungarianIcelanderIndian (Asian)IndonesianInupiatIranianIraqiIrishIroquoisIsraeliItalianJamaicanJapaneseJordanianKenyanKiowaKoreanLaotianLatvianLebaneseLiberianLithuanianLumbeeLuxembourgerMacedonianMalteseMarshalleseMenomineeMexicanMexican American IndianMongolianMoroccanNative HawaiianNavajoNepaleseNew ZealanderNicaraguanNigerianNorthern EuropeanNorwegianOkinawanOsageOttawaPaiutePakistaniPalestinianPanamanianParaguayanPennsylvania GermanPeruvianPimaPolishPortuguesePotawatomiPuebloPuerto RicanPuget Sound SalishRomanianRussianSalvadoranSamoanScandinavianScotch-IrishScottishSeminoleSenegaleseSerbianShoshoneSierra LeoneanSiouxSlavicSlovakSloveneSomaliSouth AfricanSouth AmericanSouth American IndianSoviet UnionSpaniardSpanishSpanish AmericanSpanish American IndianSri LankanSubsaharan AfricanSudaneseSwedishSwissSyrianTaiwaneseThaiTlingit-HaidaTohono O'OdhamTonganTrinidadian and TobagonianTsimshianTurkishU.S. Virgin IslanderUgandanUkrainianUruguayanUteVenezuelanVietnameseWelshWest IndianYakamaYaquiYugoslavianYumanYup'ikZimbabwean
Immigration
NonimmigrantsImmigrantsAfghanistanAfricaAlbaniaArgentinaArmeniaAsiaAustraliaAustriaBahamasBangladeshBarbadosBelarusBelgiumBelizeBoliviaBosnia and HerzegovinaBrazilBulgariaBurma/MyanmarCabo VerdeCambodiaCameroonCanadaCaribbeanCentral AmericaChileChinaColombiaCongoCosta RicaCroatiaCubaCzechoslovakiaDenmarkDominicaDominican RepublicEastern AfricaEastern AsiaEastern EuropeEcuadorEgyptEl SalvadorEnglandEritreaEthiopiaEuropeFijiFranceGermanyGhanaGreeceGrenadaGuatemalaGuyanaHaitiHondurasHong KongHungaryIndiaIndonesiaIranIraqIrelandIsraelItalyJamaicaJapanJordanKazakhstanKenyaKoreaKuwaitLaosLatin AmericaLatviaLebanonLiberiaLithuaniaMalaysiaMexicoMicronesiaMiddle AfricaMoldovaMoroccoNepalNetherlandsNicaraguaNigeriaNorth AmericaNorth MacedoniaNorthern AfricaNorthern EuropeNorwayOceaniaPakistanPanamaPeruPhilippinesPolandPortugalRomaniaRussiaSaudi ArabiaScotlandSenegalSerbiaSierra LeoneSingaporeSomaliaSouth AfricaSouth AmericaSouth Central AsiaSouth Eastern AsiaSouthern EuropeSpainSri LankaSt. Vincent and the GrenadinesSudanSwedenSwitzerlandSyriaTaiwanThailandTrinidad and TobagoTurkeyUgandaUkraineUruguayUzbekistanVenezuelaVietnamWest IndiesWestern AfricaWestern AsiaWestern EuropeYemenZaireZimbabweAzores
Malaysian
Race
Ancestry
AfghanAfricanAlaska NativeAlaskan AthabascanAlbanianAleutAlsatianAmericanApacheArabArapahoArgentineanArmenianAssyrian/Chaldean/SyriacAustralianAustrianBahamianBangladeshiBarbadianBasqueBelgianBelizeanBermudanBhutaneseBlackfeetBolivianBrazilianBritishBritish West IndianBulgarianBurmeseCajunCambodianCanadianCape VerdeanCarpatho RusynCelticCentral AmericanCentral American IndianCherokeeCheyenneChickasawChileanChineseChippewaChoctawColombianColvilleComancheCosta RicanCreeCreekCroatianCrowCubanCypriotCzechCzechoslovakianDanishDelawareDominicanDutchDutch West IndianEastern EuropeanEcuadorianEgyptianEnglishEstonianEthiopianEuropeanFijianFilipinoFinnishFrenchFrench American IndianFrench CanadianGermanGerman RussianGhanaianGreekGuamanian/ChamorroGuatemalanGuyaneseHaitianHmongHonduranHopiHoumaHungarianIcelanderIndian (Asian)IndonesianInupiatIranianIraqiIrishIroquoisIsraeliItalianJamaicanJapaneseJordanianKenyanKiowaKoreanLaotianLatvianLebaneseLiberianLithuanianLumbeeLuxembourgerMacedonianMalaysianMalteseMarshalleseMenomineeMexicanMexican American IndianMongolianMoroccanNative HawaiianNavajoNepaleseNew ZealanderNicaraguanNigerianNorthern EuropeanNorwegianOkinawanOsageOttawaPaiutePakistaniPalestinianPanamanianParaguayanPennsylvania GermanPeruvianPimaPolishPortuguesePotawatomiPuebloPuerto RicanPuget Sound SalishRomanianRussianSalvadoranSamoanScandinavianScotch-IrishScottishSeminoleSenegaleseSerbianShoshoneSierra LeoneanSiouxSlavicSlovakSloveneSomaliSouth AfricanSouth AmericanSouth American IndianSoviet UnionSpaniardSpanishSpanish AmericanSpanish American IndianSri LankanSubsaharan AfricanSudaneseSwedishSwissSyrianTaiwaneseThaiTlingit-HaidaTohono O'OdhamTonganTrinidadian and TobagonianTsimshianTurkishU.S. Virgin IslanderUgandanUkrainianUruguayanUteVenezuelanVietnameseWelshWest IndianYakamaYaquiYugoslavianYumanYup'ikZimbabwean
Immigration
NonimmigrantsImmigrantsAfghanistanAfricaAlbaniaArgentinaArmeniaAsiaAustraliaAustriaBahamasBangladeshBarbadosBelarusBelgiumBelizeBoliviaBosnia and HerzegovinaBrazilBulgariaBurma/MyanmarCabo VerdeCambodiaCameroonCanadaCaribbeanCentral AmericaChileChinaColombiaCongoCosta RicaCroatiaCubaCzechoslovakiaDenmarkDominicaDominican RepublicEastern AfricaEastern AsiaEastern EuropeEcuadorEgyptEl SalvadorEnglandEritreaEthiopiaEuropeFijiFranceGermanyGhanaGreeceGrenadaGuatemalaGuyanaHaitiHondurasHong KongHungaryIndiaIndonesiaIranIraqIrelandIsraelItalyJamaicaJapanJordanKazakhstanKenyaKoreaKuwaitLaosLatin AmericaLatviaLebanonLiberiaLithuaniaMalaysiaMexicoMicronesiaMiddle AfricaMoldovaMoroccoNepalNetherlandsNicaraguaNigeriaNorth AmericaNorth MacedoniaNorthern AfricaNorthern EuropeNorwayOceaniaPakistanPanamaPeruPhilippinesPolandPortugalRomaniaSaudi ArabiaScotlandSenegalSerbiaSierra LeoneSingaporeSomaliaSouth AfricaSouth AmericaSouth Central AsiaSouth Eastern AsiaSouthern EuropeSpainSri LankaSt. Vincent and the GrenadinesSudanSwedenSwitzerlandSyriaTaiwanThailandTrinidad and TobagoTurkeyUgandaUkraineUruguayUzbekistanVenezuelaVietnamWest IndiesWestern AfricaWestern AsiaWestern EuropeYemenZaireZimbabweAzores
Unemployment Among Ages 65 to 74 years
Income
Poverty
Unemployment
Labor Participation
Family Structure
Vehicle Availability
Education Level
Disability

Unemployment Among Ages 65 to 74 years Comparison

Immigrants from Russia

Malaysians

Excellent
Exceptional
5.3%
UNEMPLOYMENT AMONG AGES 65 TO 74 YEARS
83.0/ 100
METRIC RATING
131st/ 347
METRIC RANK
5.2%
UNEMPLOYMENT AMONG AGES 65 TO 74 YEARS
95.1/ 100
METRIC RATING
106th/ 347
METRIC RANK

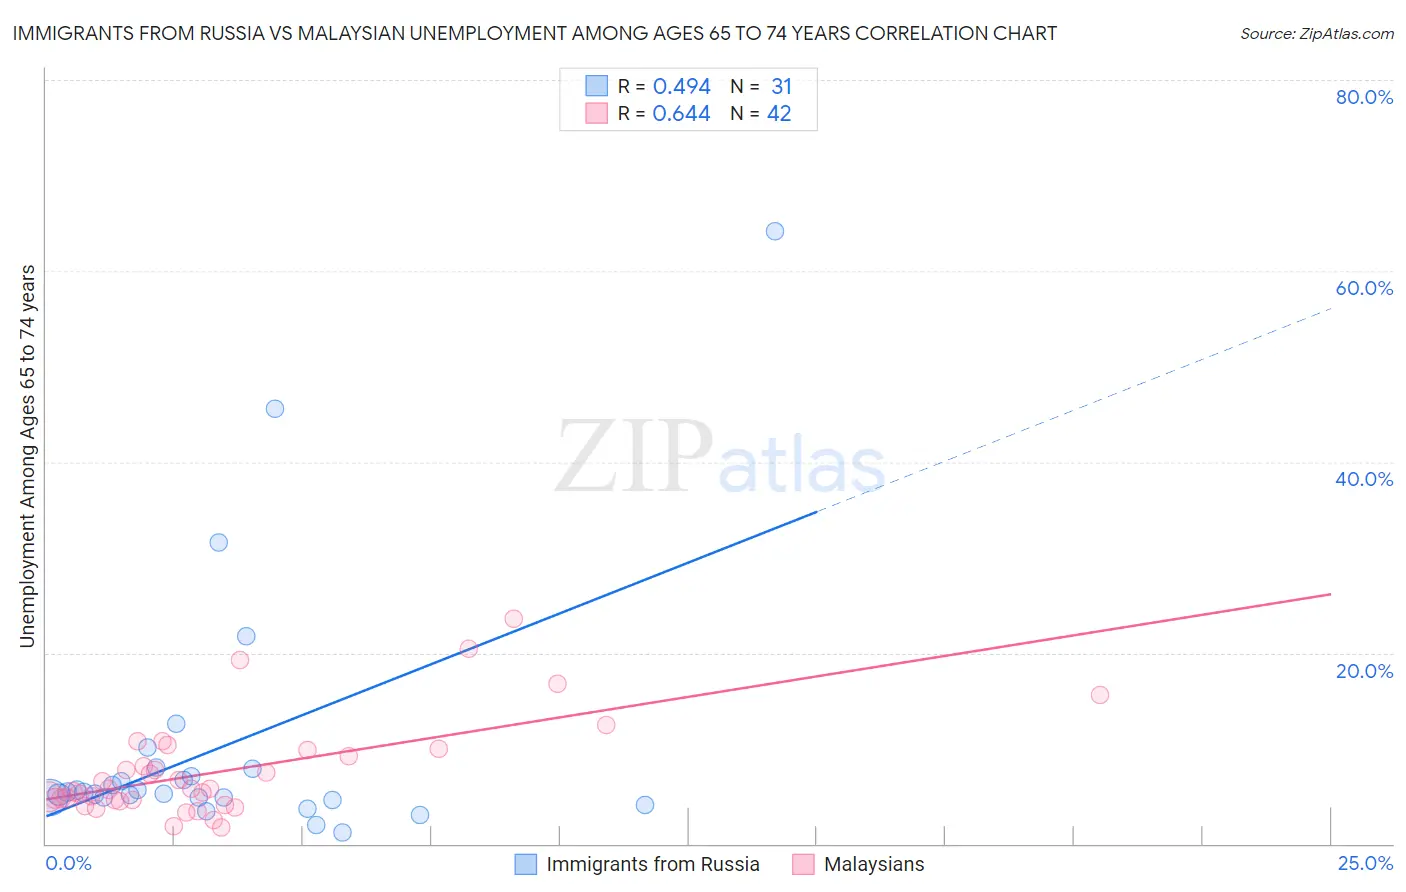
Immigrants from Russia vs Malaysian Unemployment Among Ages 65 to 74 years Correlation Chart

The statistical analysis conducted on geographies consisting of 312,358,328 people shows a moderate positive correlation between the proportion of Immigrants from Russia and unemployment rate among population between the ages 65 and 74 in the United States with a correlation coefficient (R) of 0.494 and weighted average of 5.3%. Similarly, the statistical analysis conducted on geographies consisting of 207,413,201 people shows a significant positive correlation between the proportion of Malaysians and unemployment rate among population between the ages 65 and 74 in the United States with a correlation coefficient (R) of 0.644 and weighted average of 5.2%, a difference of 1.2%.
Immigrants from Russia vs Malaysian Unemployment Among Ages 65 to 74 years

Unemployment Among Ages 65 to 74 years Correlation Summary

MeasurementImmigrants from RussiaMalaysian
Minimum1.2%1.7%
Maximum64.1%23.6%
Range62.9%21.9%
Mean10.1%7.6%
Median5.4%5.7%
Interquartile 25% (IQ1)4.8%4.5%
Interquartile 75% (IQ3)7.8%9.8%
Interquartile Range (IQR)3.0%5.3%
Standard Deviation (Sample)13.5%5.1%
Standard Deviation (Population)13.3%5.0%

Similar Demographics by Unemployment Among Ages 65 to 74 years

Demographics Similar to Immigrants from Russia by Unemployment Among Ages 65 to 74 years

In terms of unemployment among ages 65 to 74 years, the demographic groups most similar to Immigrants from Russia are Korean (5.3%, a difference of 0.020%), Ukrainian (5.3%, a difference of 0.060%), Immigrants from Panama (5.3%, a difference of 0.070%), Immigrants from Serbia (5.3%, a difference of 0.070%), and Celtic (5.3%, a difference of 0.12%).
DemographicsRating | RankUnemployment Among Ages 65 to 74 years
Immigrants | Ukraine
87.5
/100
|
#124
Excellent
5.3%
Pakistanis
87.5
/100
|
#125
Excellent
5.3%
Immigrants | South Eastern Asia
87.2
/100
|
#126
Excellent
5.3%
Immigrants | North America
86.7
/100
|
#127
Excellent
5.3%
Immigrants | Hong Kong
86.5
/100
|
#128
Excellent
5.3%
Immigrants | England
86.2
/100
|
#129
Excellent
5.3%
Eastern Europeans
85.6
/100
|
#130
Excellent
5.3%
Immigrants | Russia
83.0
/100
|
#131
Excellent
5.3%
Koreans
82.6
/100
|
#132
Excellent
5.3%
Ukrainians
82.0
/100
|
#133
Excellent
5.3%
Immigrants | Panama
81.8
/100
|
#134
Excellent
5.3%
Immigrants | Serbia
81.8
/100
|
#135
Excellent
5.3%
Celtics
80.8
/100
|
#136
Excellent
5.3%
Immigrants | Afghanistan
80.8
/100
|
#137
Excellent
5.3%
Chileans
79.7
/100
|
#138
Good
5.3%

Demographics Similar to Malaysians by Unemployment Among Ages 65 to 74 years

In terms of unemployment among ages 65 to 74 years, the demographic groups most similar to Malaysians are Iranian (5.2%, a difference of 0.020%), Yugoslavian (5.2%, a difference of 0.070%), Immigrants from Vietnam (5.2%, a difference of 0.090%), Austrian (5.2%, a difference of 0.11%), and Immigrants from Lithuania (5.2%, a difference of 0.15%).
DemographicsRating | RankUnemployment Among Ages 65 to 74 years
Burmese
96.4
/100
|
#99
Exceptional
5.2%
Japanese
96.4
/100
|
#100
Exceptional
5.2%
Immigrants | Cambodia
96.3
/100
|
#101
Exceptional
5.2%
Immigrants | Lithuania
95.9
/100
|
#102
Exceptional
5.2%
Immigrants | Vietnam
95.6
/100
|
#103
Exceptional
5.2%
Yugoslavians
95.5
/100
|
#104
Exceptional
5.2%
Iranians
95.2
/100
|
#105
Exceptional
5.2%
Malaysians
95.1
/100
|
#106
Exceptional
5.2%
Austrians
94.5
/100
|
#107
Exceptional
5.2%
Immigrants | Malaysia
94.1
/100
|
#108
Exceptional
5.2%
Immigrants | Singapore
93.9
/100
|
#109
Exceptional
5.2%
Immigrants | Bolivia
93.6
/100
|
#110
Exceptional
5.2%
Sri Lankans
92.7
/100
|
#111
Exceptional
5.3%
Immigrants | South Central Asia
92.4
/100
|
#112
Exceptional
5.3%
Immigrants | Germany
91.6
/100
|
#113
Exceptional
5.3%