Immigrants from Russia vs Malaysian Unemployment Among Seniors over 75 years

COMPARE

Immigrants from Russia
Race
Ancestry
AfghanAfricanAlaska NativeAlaskan AthabascanAlbanianAleutAlsatianAmericanApacheArabArapahoArgentineanArmenianAssyrian/Chaldean/SyriacAustralianAustrianBahamianBangladeshiBarbadianBasqueBelgianBelizeanBermudanBhutaneseBlackfeetBolivianBrazilianBritishBritish West IndianBulgarianBurmeseCajunCambodianCanadianCape VerdeanCarpatho RusynCelticCentral AmericanCentral American IndianCherokeeCheyenneChickasawChileanChineseChippewaChoctawColombianColvilleComancheCosta RicanCreeCreekCroatianCrowCubanCypriotCzechCzechoslovakianDanishDelawareDominicanDutchDutch West IndianEastern EuropeanEcuadorianEgyptianEnglishEstonianEthiopianEuropeanFijianFilipinoFinnishFrenchFrench American IndianFrench CanadianGermanGerman RussianGhanaianGreekGuamanian/ChamorroGuatemalanGuyaneseHaitianHmongHonduranHopiHoumaHungarianIcelanderIndian (Asian)IndonesianInupiatIranianIraqiIrishIroquoisIsraeliItalianJamaicanJapaneseJordanianKenyanKiowaKoreanLaotianLatvianLebaneseLiberianLithuanianLumbeeLuxembourgerMacedonianMalteseMarshalleseMexicanMexican American IndianMongolianMoroccanNative HawaiianNavajoNepaleseNew ZealanderNicaraguanNigerianNorthern EuropeanNorwegianOkinawanOsageOttawaPaiutePakistaniPalestinianPanamanianParaguayanPennsylvania GermanPeruvianPimaPolishPortuguesePotawatomiPuebloPuerto RicanPuget Sound SalishRomanianRussianSalvadoranSamoanScandinavianScotch-IrishScottishSeminoleSenegaleseSerbianShoshoneSierra LeoneanSiouxSlavicSlovakSloveneSomaliSouth AfricanSouth AmericanSouth American IndianSoviet UnionSpaniardSpanishSpanish AmericanSpanish American IndianSri LankanSubsaharan AfricanSudaneseSwedishSwissSyrianTaiwaneseThaiTlingit-HaidaTohono O'OdhamTonganTrinidadian and TobagonianTsimshianTurkishU.S. Virgin IslanderUgandanUkrainianUruguayanUteVenezuelanVietnameseWelshWest IndianYakamaYaquiYugoslavianYumanYup'ikZimbabwean
Immigration
NonimmigrantsImmigrantsAfghanistanAfricaAlbaniaArgentinaArmeniaAsiaAustraliaAustriaBahamasBangladeshBarbadosBelarusBelgiumBelizeBoliviaBosnia and HerzegovinaBrazilBulgariaBurma/MyanmarCabo VerdeCambodiaCameroonCanadaCaribbeanCentral AmericaChileChinaColombiaCongoCosta RicaCroatiaCubaCzechoslovakiaDenmarkDominicaDominican RepublicEastern AfricaEastern AsiaEastern EuropeEcuadorEgyptEl SalvadorEnglandEritreaEthiopiaEuropeFijiFranceGermanyGhanaGreeceGrenadaGuatemalaGuyanaHaitiHondurasHong KongHungaryIndiaIndonesiaIranIraqIrelandIsraelItalyJamaicaJapanJordanKazakhstanKenyaKoreaKuwaitLaosLatin AmericaLatviaLebanonLiberiaLithuaniaMalaysiaMexicoMicronesiaMiddle AfricaMoldovaMoroccoNepalNetherlandsNicaraguaNigeriaNorth AmericaNorth MacedoniaNorthern AfricaNorthern EuropeNorwayOceaniaPakistanPanamaPeruPhilippinesPolandPortugalRomaniaRussiaSaudi ArabiaScotlandSenegalSerbiaSierra LeoneSingaporeSomaliaSouth AfricaSouth AmericaSouth Central AsiaSouth Eastern AsiaSouthern EuropeSpainSri LankaSt. Vincent and the GrenadinesSudanSwedenSwitzerlandSyriaTaiwanThailandTrinidad and TobagoTurkeyUgandaUkraineUruguayUzbekistanVenezuelaVietnamWest IndiesWestern AfricaWestern AsiaWestern EuropeYemenZaireZimbabweAzores
Malaysian
Race
Ancestry
AfghanAfricanAlaska NativeAlaskan AthabascanAlbanianAleutAlsatianAmericanApacheArabArapahoArgentineanArmenianAssyrian/Chaldean/SyriacAustralianAustrianBahamianBangladeshiBarbadianBasqueBelgianBelizeanBermudanBhutaneseBlackfeetBolivianBrazilianBritishBritish West IndianBulgarianBurmeseCajunCambodianCanadianCape VerdeanCarpatho RusynCelticCentral AmericanCentral American IndianCherokeeCheyenneChickasawChileanChineseChippewaChoctawColombianColvilleComancheCosta RicanCreeCreekCroatianCrowCubanCypriotCzechCzechoslovakianDanishDelawareDominicanDutchDutch West IndianEastern EuropeanEcuadorianEgyptianEnglishEstonianEthiopianEuropeanFijianFilipinoFinnishFrenchFrench American IndianFrench CanadianGermanGerman RussianGhanaianGreekGuamanian/ChamorroGuatemalanGuyaneseHaitianHmongHonduranHopiHoumaHungarianIcelanderIndian (Asian)IndonesianInupiatIranianIraqiIrishIroquoisIsraeliItalianJamaicanJapaneseJordanianKenyanKiowaKoreanLaotianLatvianLebaneseLiberianLithuanianLumbeeLuxembourgerMacedonianMalaysianMalteseMarshalleseMexicanMexican American IndianMongolianMoroccanNative HawaiianNavajoNepaleseNew ZealanderNicaraguanNigerianNorthern EuropeanNorwegianOkinawanOsageOttawaPaiutePakistaniPalestinianPanamanianParaguayanPennsylvania GermanPeruvianPimaPolishPortuguesePotawatomiPuebloPuerto RicanPuget Sound SalishRomanianRussianSalvadoranSamoanScandinavianScotch-IrishScottishSeminoleSenegaleseSerbianShoshoneSierra LeoneanSiouxSlavicSlovakSloveneSomaliSouth AfricanSouth AmericanSouth American IndianSoviet UnionSpaniardSpanishSpanish AmericanSpanish American IndianSri LankanSubsaharan AfricanSudaneseSwedishSwissSyrianTaiwaneseThaiTlingit-HaidaTohono O'OdhamTonganTrinidadian and TobagonianTsimshianTurkishU.S. Virgin IslanderUgandanUkrainianUruguayanUteVenezuelanVietnameseWelshWest IndianYakamaYaquiYugoslavianYumanYup'ikZimbabwean
Immigration
NonimmigrantsImmigrantsAfghanistanAfricaAlbaniaArgentinaArmeniaAsiaAustraliaAustriaBahamasBangladeshBarbadosBelarusBelgiumBelizeBoliviaBosnia and HerzegovinaBrazilBulgariaBurma/MyanmarCabo VerdeCambodiaCameroonCanadaCaribbeanCentral AmericaChileChinaColombiaCongoCosta RicaCroatiaCubaCzechoslovakiaDenmarkDominicaDominican RepublicEastern AfricaEastern AsiaEastern EuropeEcuadorEgyptEl SalvadorEnglandEritreaEthiopiaEuropeFijiFranceGermanyGhanaGreeceGrenadaGuatemalaGuyanaHaitiHondurasHong KongHungaryIndiaIndonesiaIranIraqIrelandIsraelItalyJamaicaJapanJordanKazakhstanKenyaKoreaKuwaitLaosLatin AmericaLatviaLebanonLiberiaLithuaniaMalaysiaMexicoMicronesiaMiddle AfricaMoldovaMoroccoNepalNetherlandsNicaraguaNigeriaNorth AmericaNorth MacedoniaNorthern AfricaNorthern EuropeNorwayOceaniaPakistanPanamaPeruPhilippinesPolandPortugalRomaniaSaudi ArabiaScotlandSenegalSerbiaSierra LeoneSingaporeSomaliaSouth AfricaSouth AmericaSouth Central AsiaSouth Eastern AsiaSouthern EuropeSpainSri LankaSt. Vincent and the GrenadinesSudanSwedenSwitzerlandSyriaTaiwanThailandTrinidad and TobagoTurkeyUgandaUkraineUruguayUzbekistanVenezuelaVietnamWest IndiesWestern AfricaWestern AsiaWestern EuropeYemenZaireZimbabweAzores
Unemployment Among Seniors over 75 years
Income
Poverty
Unemployment
Labor Participation
Family Structure
Vehicle Availability
Education Level
Disability

Unemployment Among Seniors over 75 years Comparison

Immigrants from Russia

Malaysians

Exceptional
Poor
8.3%
UNEMPLOYMENT AMONG SENIORS OVER 75 YEARS
97.1/ 100
METRIC RATING
122nd/ 347
METRIC RANK
8.9%
UNEMPLOYMENT AMONG SENIORS OVER 75 YEARS
16.3/ 100
METRIC RATING
207th/ 347
METRIC RANK

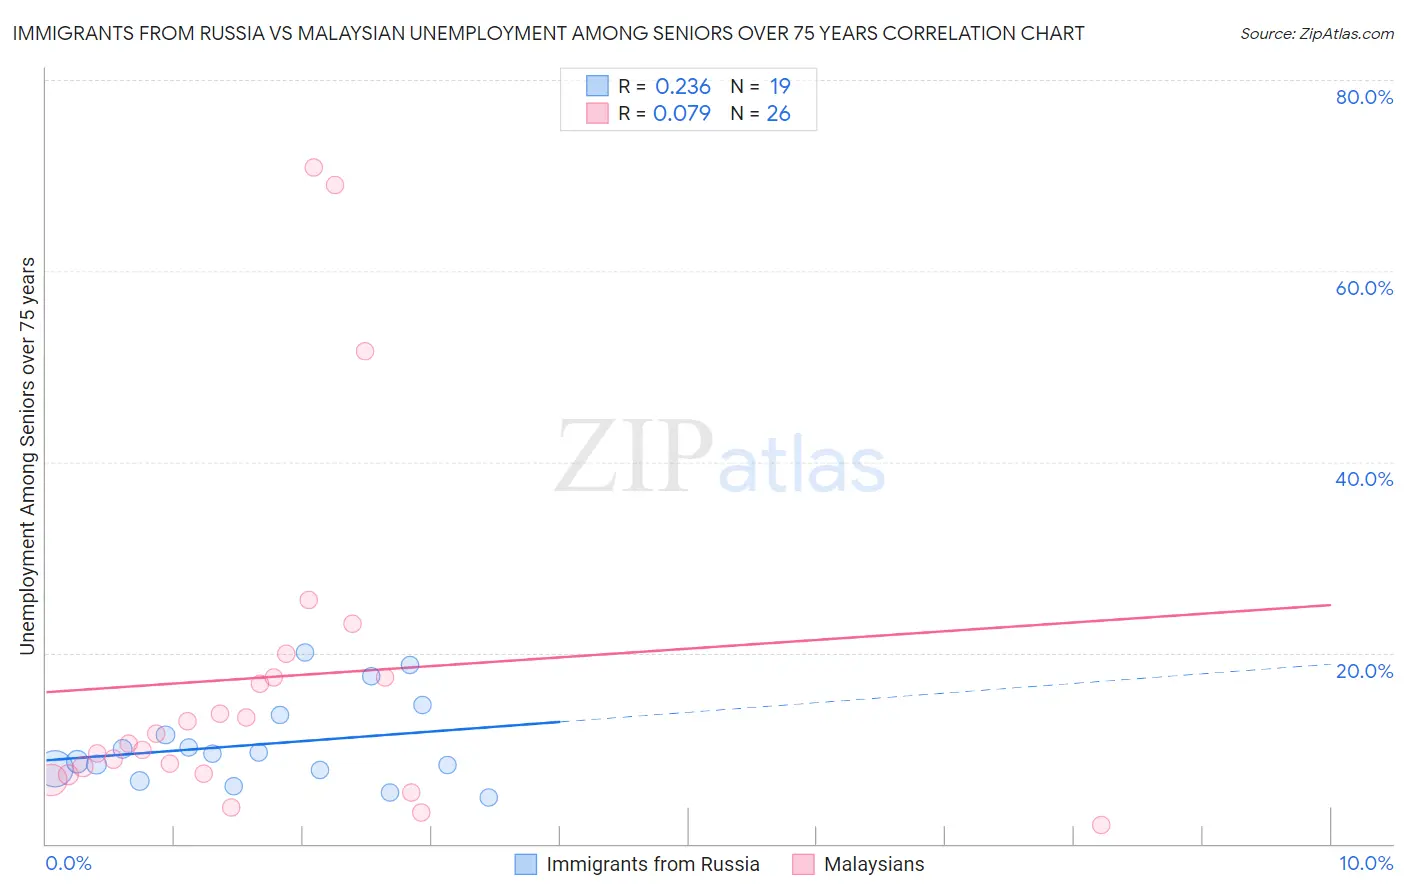
Immigrants from Russia vs Malaysian Unemployment Among Seniors over 75 years Correlation Chart

The statistical analysis conducted on geographies consisting of 186,653,187 people shows a weak positive correlation between the proportion of Immigrants from Russia and unemployment rate among seniors over the age of 75 in the United States with a correlation coefficient (R) of 0.236 and weighted average of 8.3%. Similarly, the statistical analysis conducted on geographies consisting of 134,888,920 people shows a slight positive correlation between the proportion of Malaysians and unemployment rate among seniors over the age of 75 in the United States with a correlation coefficient (R) of 0.079 and weighted average of 8.9%, a difference of 7.2%.
Immigrants from Russia vs Malaysian Unemployment Among Seniors over 75 years

Unemployment Among Seniors over 75 years Correlation Summary

MeasurementImmigrants from RussiaMalaysian
Minimum4.9%1.9%
Maximum20.0%70.8%
Range15.1%68.9%
Mean10.4%17.4%
Median9.5%11.0%
Interquartile 25% (IQ1)7.7%7.3%
Interquartile 75% (IQ3)13.4%17.4%
Interquartile Range (IQR)5.7%10.1%
Standard Deviation (Sample)4.5%18.3%
Standard Deviation (Population)4.3%17.9%

Similar Demographics by Unemployment Among Seniors over 75 years

Demographics Similar to Immigrants from Russia by Unemployment Among Seniors over 75 years

In terms of unemployment among seniors over 75 years, the demographic groups most similar to Immigrants from Russia are Immigrants from Croatia (8.3%, a difference of 0.070%), Immigrants from Nepal (8.3%, a difference of 0.080%), Thai (8.3%, a difference of 0.12%), Immigrants from Moldova (8.3%, a difference of 0.14%), and Immigrants from Asia (8.3%, a difference of 0.20%).
DemographicsRating | RankUnemployment Among Seniors over 75 years
Sudanese
98.2
/100
|
#115
Exceptional
8.3%
Immigrants | West Indies
98.1
/100
|
#116
Exceptional
8.3%
Immigrants | Greece
97.9
/100
|
#117
Exceptional
8.3%
Immigrants | Middle Africa
97.9
/100
|
#118
Exceptional
8.3%
Japanese
97.5
/100
|
#119
Exceptional
8.3%
Immigrants | Asia
97.4
/100
|
#120
Exceptional
8.3%
Immigrants | Croatia
97.2
/100
|
#121
Exceptional
8.3%
Immigrants | Russia
97.1
/100
|
#122
Exceptional
8.3%
Immigrants | Nepal
96.9
/100
|
#123
Exceptional
8.3%
Thais
96.8
/100
|
#124
Exceptional
8.3%
Immigrants | Moldova
96.7
/100
|
#125
Exceptional
8.3%
Belizeans
96.3
/100
|
#126
Exceptional
8.4%
Hondurans
96.2
/100
|
#127
Exceptional
8.4%
Native Hawaiians
96.1
/100
|
#128
Exceptional
8.4%
Ghanaians
96.0
/100
|
#129
Exceptional
8.4%

Demographics Similar to Malaysians by Unemployment Among Seniors over 75 years

In terms of unemployment among seniors over 75 years, the demographic groups most similar to Malaysians are Immigrants from Philippines (8.9%, a difference of 0.040%), Salvadoran (8.9%, a difference of 0.090%), Bermudan (8.9%, a difference of 0.13%), Delaware (9.0%, a difference of 0.17%), and Immigrants from Western Europe (8.9%, a difference of 0.18%).
DemographicsRating | RankUnemployment Among Seniors over 75 years
Osage
25.4
/100
|
#200
Fair
8.9%
Immigrants | Peru
24.3
/100
|
#201
Fair
8.9%
Russians
24.1
/100
|
#202
Fair
8.9%
Immigrants | Northern Europe
23.9
/100
|
#203
Fair
8.9%
Spaniards
22.0
/100
|
#204
Fair
8.9%
Koreans
21.9
/100
|
#205
Fair
8.9%
Immigrants | Western Europe
18.2
/100
|
#206
Poor
8.9%
Malaysians
16.3
/100
|
#207
Poor
8.9%
Immigrants | Philippines
15.8
/100
|
#208
Poor
8.9%
Salvadorans
15.4
/100
|
#209
Poor
8.9%
Bermudans
15.0
/100
|
#210
Poor
8.9%
Delaware
14.6
/100
|
#211
Poor
9.0%
Romanians
13.8
/100
|
#212
Poor
9.0%
Immigrants | Latin America
13.4
/100
|
#213
Poor
9.0%
Immigrants | Brazil
13.3
/100
|
#214
Poor
9.0%