Immigrants from Portugal vs Immigrants from Chile Unemployment Among Ages 45 to 54 years

COMPARE

Immigrants from Portugal
Race
Ancestry
AfghanAfricanAlaska NativeAlaskan AthabascanAlbanianAleutAlsatianAmericanApacheArabArapahoArgentineanArmenianAssyrian/Chaldean/SyriacAustralianAustrianBahamianBangladeshiBarbadianBasqueBelgianBelizeanBermudanBhutaneseBlackfeetBolivianBrazilianBritishBritish West IndianBulgarianBurmeseCajunCambodianCanadianCape VerdeanCarpatho RusynCelticCentral AmericanCentral American IndianCherokeeCheyenneChickasawChileanChineseChippewaChoctawColombianColvilleComancheCosta RicanCreeCreekCroatianCrowCubanCypriotCzechCzechoslovakianDanishDelawareDominicanDutchDutch West IndianEastern EuropeanEcuadorianEgyptianEnglishEstonianEthiopianEuropeanFijianFilipinoFinnishFrenchFrench American IndianFrench CanadianGermanGerman RussianGhanaianGreekGuamanian/ChamorroGuatemalanGuyaneseHaitianHmongHonduranHopiHoumaHungarianIcelanderIndian (Asian)IndonesianInupiatIranianIraqiIrishIroquoisIsraeliItalianJamaicanJapaneseJordanianKenyanKiowaKoreanLaotianLatvianLebaneseLiberianLithuanianLumbeeLuxembourgerMacedonianMalaysianMalteseMarshalleseMenomineeMexicanMexican American IndianMongolianMoroccanNative HawaiianNavajoNepaleseNew ZealanderNicaraguanNigerianNorthern EuropeanNorwegianOkinawanOsageOttawaPaiutePakistaniPalestinianPanamanianParaguayanPennsylvania GermanPeruvianPimaPolishPortuguesePotawatomiPuebloPuerto RicanPuget Sound SalishRomanianRussianSalvadoranSamoanScandinavianScotch-IrishScottishSeminoleSenegaleseSerbianShoshoneSierra LeoneanSiouxSlavicSlovakSloveneSomaliSouth AfricanSouth AmericanSouth American IndianSoviet UnionSpaniardSpanishSpanish AmericanSpanish American IndianSri LankanSubsaharan AfricanSudaneseSwedishSwissSyrianTaiwaneseThaiTlingit-HaidaTohono O'OdhamTonganTrinidadian and TobagonianTsimshianTurkishU.S. Virgin IslanderUgandanUkrainianUruguayanUteVenezuelanVietnameseWelshWest IndianYakamaYaquiYugoslavianYumanYup'ikZimbabwean
Immigration
NonimmigrantsImmigrantsAfghanistanAfricaAlbaniaArgentinaArmeniaAsiaAustraliaAustriaBahamasBangladeshBarbadosBelarusBelgiumBelizeBoliviaBosnia and HerzegovinaBrazilBulgariaBurma/MyanmarCabo VerdeCambodiaCameroonCanadaCaribbeanCentral AmericaChinaColombiaCongoCosta RicaCroatiaCubaCzechoslovakiaDenmarkDominicaDominican RepublicEastern AfricaEastern AsiaEastern EuropeEcuadorEgyptEl SalvadorEnglandEritreaEthiopiaEuropeFijiFranceGermanyGhanaGreeceGrenadaGuatemalaGuyanaHaitiHondurasHong KongHungaryIndiaIndonesiaIranIraqIrelandIsraelItalyJamaicaJapanJordanKazakhstanKenyaKoreaKuwaitLaosLatin AmericaLatviaLebanonLiberiaLithuaniaMalaysiaMexicoMicronesiaMiddle AfricaMoldovaMoroccoNepalNetherlandsNicaraguaNigeriaNorth AmericaNorth MacedoniaNorthern AfricaNorthern EuropeNorwayOceaniaPakistanPanamaPeruPhilippinesPolandPortugalRomaniaRussiaSaudi ArabiaScotlandSenegalSerbiaSierra LeoneSingaporeSomaliaSouth AfricaSouth AmericaSouth Central AsiaSouth Eastern AsiaSouthern EuropeSpainSri LankaSt. Vincent and the GrenadinesSudanSwedenSwitzerlandSyriaTaiwanThailandTrinidad and TobagoTurkeyUgandaUkraineUruguayUzbekistanVenezuelaVietnamWest IndiesWestern AfricaWestern AsiaWestern EuropeYemenZaireZimbabweAzores
Immigrants from Chile
Race
Ancestry
AfghanAfricanAlaska NativeAlaskan AthabascanAlbanianAleutAlsatianAmericanApacheArabArapahoArgentineanArmenianAssyrian/Chaldean/SyriacAustralianAustrianBahamianBangladeshiBarbadianBasqueBelgianBelizeanBermudanBhutaneseBlackfeetBolivianBrazilianBritishBritish West IndianBulgarianBurmeseCajunCambodianCanadianCape VerdeanCarpatho RusynCelticCentral AmericanCentral American IndianCherokeeCheyenneChickasawChileanChineseChippewaChoctawColombianColvilleComancheCosta RicanCreeCreekCroatianCrowCubanCypriotCzechCzechoslovakianDanishDelawareDominicanDutchDutch West IndianEastern EuropeanEcuadorianEgyptianEnglishEstonianEthiopianEuropeanFijianFilipinoFinnishFrenchFrench American IndianFrench CanadianGermanGerman RussianGhanaianGreekGuamanian/ChamorroGuatemalanGuyaneseHaitianHmongHonduranHopiHoumaHungarianIcelanderIndian (Asian)IndonesianInupiatIranianIraqiIrishIroquoisIsraeliItalianJamaicanJapaneseJordanianKenyanKiowaKoreanLaotianLatvianLebaneseLiberianLithuanianLumbeeLuxembourgerMacedonianMalaysianMalteseMarshalleseMenomineeMexicanMexican American IndianMongolianMoroccanNative HawaiianNavajoNepaleseNew ZealanderNicaraguanNigerianNorthern EuropeanNorwegianOkinawanOsageOttawaPaiutePakistaniPalestinianPanamanianParaguayanPennsylvania GermanPeruvianPimaPolishPortuguesePotawatomiPuebloPuerto RicanPuget Sound SalishRomanianRussianSalvadoranSamoanScandinavianScotch-IrishScottishSeminoleSenegaleseSerbianShoshoneSierra LeoneanSiouxSlavicSlovakSloveneSomaliSouth AfricanSouth AmericanSouth American IndianSoviet UnionSpaniardSpanishSpanish AmericanSpanish American IndianSri LankanSubsaharan AfricanSudaneseSwedishSwissSyrianTaiwaneseThaiTlingit-HaidaTohono O'OdhamTonganTrinidadian and TobagonianTsimshianTurkishU.S. Virgin IslanderUgandanUkrainianUruguayanUteVenezuelanVietnameseWelshWest IndianYakamaYaquiYugoslavianYumanYup'ikZimbabwean
Immigration
NonimmigrantsImmigrantsAfghanistanAfricaAlbaniaArgentinaArmeniaAsiaAustraliaAustriaBahamasBangladeshBarbadosBelarusBelgiumBelizeBoliviaBosnia and HerzegovinaBrazilBulgariaBurma/MyanmarCabo VerdeCambodiaCameroonCanadaCaribbeanCentral AmericaChileChinaColombiaCongoCosta RicaCroatiaCubaCzechoslovakiaDenmarkDominicaDominican RepublicEastern AfricaEastern AsiaEastern EuropeEcuadorEgyptEl SalvadorEnglandEritreaEthiopiaEuropeFijiFranceGermanyGhanaGreeceGrenadaGuatemalaGuyanaHaitiHondurasHong KongHungaryIndiaIndonesiaIranIraqIrelandIsraelItalyJamaicaJapanJordanKazakhstanKenyaKoreaKuwaitLaosLatin AmericaLatviaLebanonLiberiaLithuaniaMalaysiaMexicoMicronesiaMiddle AfricaMoldovaMoroccoNepalNetherlandsNicaraguaNigeriaNorth AmericaNorth MacedoniaNorthern AfricaNorthern EuropeNorwayOceaniaPakistanPanamaPeruPhilippinesPolandRomaniaRussiaSaudi ArabiaScotlandSenegalSerbiaSierra LeoneSingaporeSomaliaSouth AfricaSouth AmericaSouth Central AsiaSouth Eastern AsiaSouthern EuropeSpainSri LankaSt. Vincent and the GrenadinesSudanSwedenSwitzerlandSyriaTaiwanThailandTrinidad and TobagoTurkeyUgandaUkraineUruguayUzbekistanVenezuelaVietnamWest IndiesWestern AfricaWestern AsiaWestern EuropeYemenZaireZimbabweAzores
Unemployment Among Ages 45 to 54 years
Income
Poverty
Unemployment
Labor Participation
Family Structure
Vehicle Availability
Education Level
Disability

Unemployment Among Ages 45 to 54 years Comparison

Immigrants from Portugal

Immigrants from Chile

Tragic
Exceptional
5.2%
UNEMPLOYMENT AMONG AGES 45 TO 54 YEARS
0.0/ 100
METRIC RATING
290th/ 347
METRIC RANK
4.4%
UNEMPLOYMENT AMONG AGES 45 TO 54 YEARS
90.9/ 100
METRIC RATING
114th/ 347
METRIC RANK

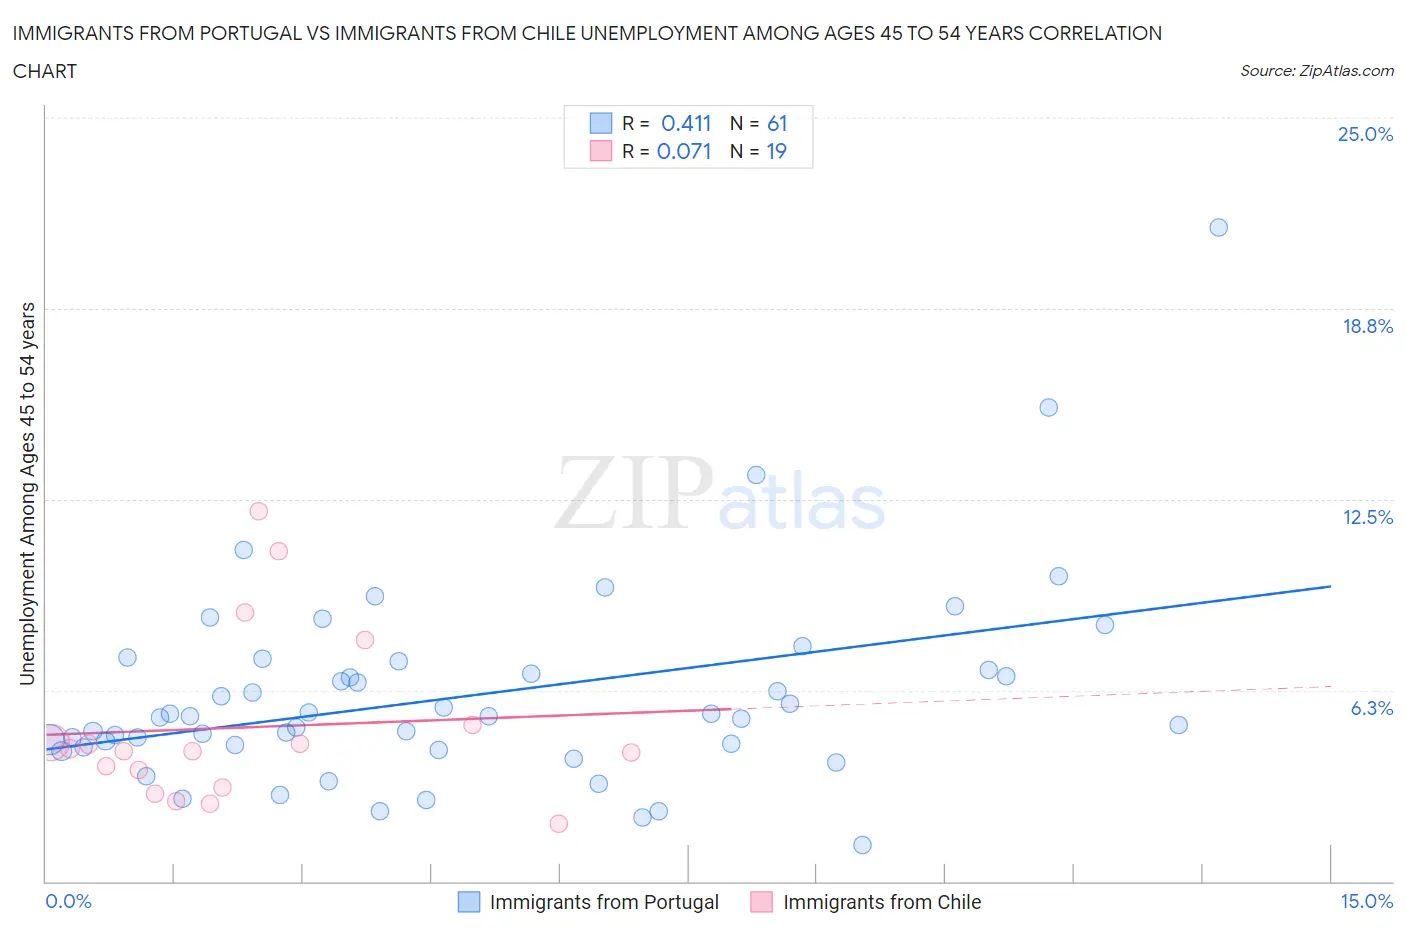
Immigrants from Portugal vs Immigrants from Chile Unemployment Among Ages 45 to 54 years Correlation Chart

The statistical analysis conducted on geographies consisting of 172,906,656 people shows a moderate positive correlation between the proportion of Immigrants from Portugal and unemployment rate among population between the ages 45 and 54 in the United States with a correlation coefficient (R) of 0.411 and weighted average of 5.2%. Similarly, the statistical analysis conducted on geographies consisting of 216,546,839 people shows a slight positive correlation between the proportion of Immigrants from Chile and unemployment rate among population between the ages 45 and 54 in the United States with a correlation coefficient (R) of 0.071 and weighted average of 4.4%, a difference of 18.3%.
Immigrants from Portugal vs Immigrants from Chile Unemployment Among Ages 45 to 54 years

Unemployment Among Ages 45 to 54 years Correlation Summary

MeasurementImmigrants from PortugalImmigrants from Chile
Minimum1.2%1.9%
Maximum21.4%12.1%
Range20.2%10.2%
Mean6.1%5.0%
Median5.4%4.3%
Interquartile 25% (IQ1)4.4%3.1%
Interquartile 75% (IQ3)7.0%5.1%
Interquartile Range (IQR)2.6%2.0%
Standard Deviation (Sample)3.3%2.8%
Standard Deviation (Population)3.2%2.7%

Similar Demographics by Unemployment Among Ages 45 to 54 years

Demographics Similar to Immigrants from Portugal by Unemployment Among Ages 45 to 54 years

In terms of unemployment among ages 45 to 54 years, the demographic groups most similar to Immigrants from Portugal are Armenian (5.2%, a difference of 0.0%), Immigrants from Haiti (5.2%, a difference of 0.16%), Trinidadian and Tobagonian (5.2%, a difference of 0.24%), Immigrants from Senegal (5.2%, a difference of 0.25%), and Immigrants from Caribbean (5.2%, a difference of 0.56%).
DemographicsRating | RankUnemployment Among Ages 45 to 54 years
Hispanics or Latinos
0.0
/100
|
#283
Tragic
5.1%
Kiowa
0.0
/100
|
#284
Tragic
5.1%
Iroquois
0.0
/100
|
#285
Tragic
5.1%
Senegalese
0.0
/100
|
#286
Tragic
5.1%
Haitians
0.0
/100
|
#287
Tragic
5.2%
Immigrants | Caribbean
0.0
/100
|
#288
Tragic
5.2%
Immigrants | Haiti
0.0
/100
|
#289
Tragic
5.2%
Immigrants | Portugal
0.0
/100
|
#290
Tragic
5.2%
Armenians
0.0
/100
|
#291
Tragic
5.2%
Trinidadians and Tobagonians
0.0
/100
|
#292
Tragic
5.2%
Immigrants | Senegal
0.0
/100
|
#293
Tragic
5.2%
Belizeans
0.0
/100
|
#294
Tragic
5.2%
Jamaicans
0.0
/100
|
#295
Tragic
5.3%
Aleuts
0.0
/100
|
#296
Tragic
5.3%
West Indians
0.0
/100
|
#297
Tragic
5.3%

Demographics Similar to Immigrants from Chile by Unemployment Among Ages 45 to 54 years

In terms of unemployment among ages 45 to 54 years, the demographic groups most similar to Immigrants from Chile are Immigrants from Saudi Arabia (4.4%, a difference of 0.020%), French Canadian (4.4%, a difference of 0.020%), Pakistani (4.4%, a difference of 0.020%), Immigrants from North Macedonia (4.4%, a difference of 0.040%), and Immigrants from Nicaragua (4.4%, a difference of 0.060%).
DemographicsRating | RankUnemployment Among Ages 45 to 54 years
Immigrants | South Africa
92.5
/100
|
#107
Exceptional
4.4%
Russians
92.1
/100
|
#108
Exceptional
4.4%
New Zealanders
91.9
/100
|
#109
Exceptional
4.4%
Immigrants | England
91.3
/100
|
#110
Exceptional
4.4%
Immigrants | Nicaragua
91.3
/100
|
#111
Exceptional
4.4%
Immigrants | Saudi Arabia
91.1
/100
|
#112
Exceptional
4.4%
French Canadians
91.0
/100
|
#113
Exceptional
4.4%
Immigrants | Chile
90.9
/100
|
#114
Exceptional
4.4%
Pakistanis
90.7
/100
|
#115
Exceptional
4.4%
Immigrants | North Macedonia
90.6
/100
|
#116
Exceptional
4.4%
South Africans
90.4
/100
|
#117
Exceptional
4.4%
Immigrants | Romania
90.0
/100
|
#118
Exceptional
4.4%
Native Hawaiians
90.0
/100
|
#119
Excellent
4.4%
Americans
89.6
/100
|
#120
Excellent
4.4%
Immigrants | Oceania
89.5
/100
|
#121
Excellent
4.4%