Immigrants from Peru vs Mexican American Indian Unemployment Among Women with Children Under 6 years
COMPARE
Immigrants from Peru
Mexican American Indian
Unemployment Among Women with Children Under 6 years
Unemployment Among Women with Children Under 6 years Comparison
Immigrants from Peru
Mexican American Indians
7.5%
UNEMPLOYMENT AMONG WOMEN WITH CHILDREN UNDER 6 YEARS
74.9/ 100
METRIC RATING
151st/ 347
METRIC RANK
8.5%
UNEMPLOYMENT AMONG WOMEN WITH CHILDREN UNDER 6 YEARS
0.1/ 100
METRIC RATING
272nd/ 347
METRIC RANK
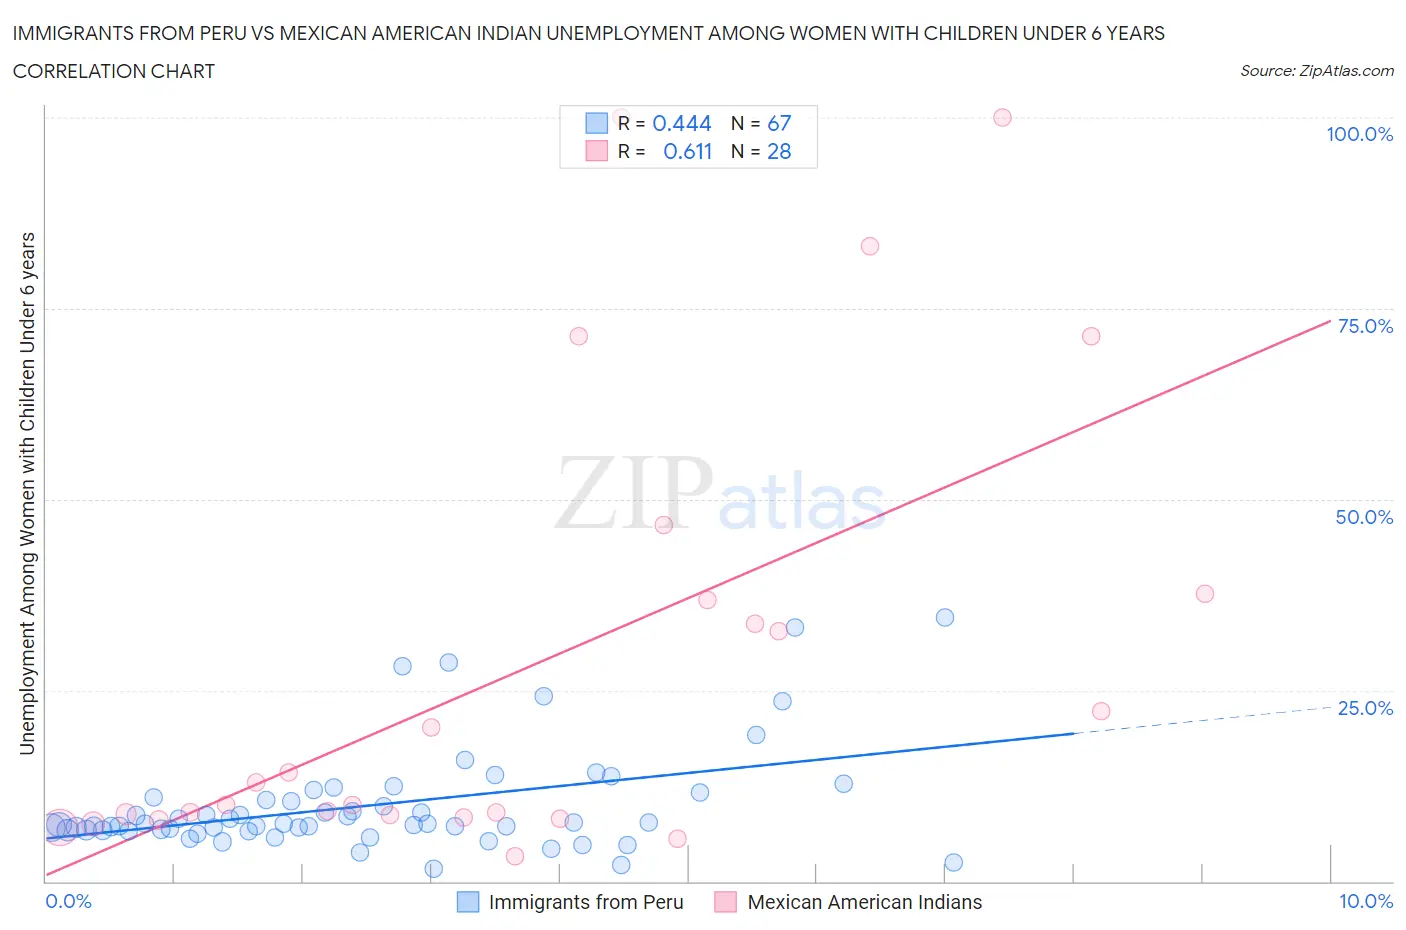
Immigrants from Peru vs Mexican American Indian Unemployment Among Women with Children Under 6 years Correlation Chart
The statistical analysis conducted on geographies consisting of 264,130,513 people shows a moderate positive correlation between the proportion of Immigrants from Peru and unemployment rate among women with children under the age of 6 in the United States with a correlation coefficient (R) of 0.444 and weighted average of 7.5%. Similarly, the statistical analysis conducted on geographies consisting of 260,154,891 people shows a significant positive correlation between the proportion of Mexican American Indians and unemployment rate among women with children under the age of 6 in the United States with a correlation coefficient (R) of 0.611 and weighted average of 8.5%, a difference of 13.4%.
Unemployment Among Women with Children Under 6 years Correlation Summary
| Measurement | Immigrants from Peru | Mexican American Indian |
| Minimum | 1.7% | 3.3% |
| Maximum | 34.5% | 100.0% |
| Range | 32.8% | 96.7% |
| Mean | 9.9% | 28.4% |
| Median | 7.5% | 11.4% |
| Interquartile 25% (IQ1) | 6.7% | 8.5% |
| Interquartile 75% (IQ3) | 11.0% | 37.3% |
| Interquartile Range (IQR) | 4.3% | 28.8% |
| Standard Deviation (Sample) | 6.8% | 29.7% |
| Standard Deviation (Population) | 6.7% | 29.2% |
Similar Demographics by Unemployment Among Women with Children Under 6 years
Demographics Similar to Immigrants from Peru by Unemployment Among Women with Children Under 6 years
In terms of unemployment among women with children under 6 years, the demographic groups most similar to Immigrants from Peru are Bangladeshi (7.5%, a difference of 0.010%), Uruguayan (7.5%, a difference of 0.020%), Northern European (7.5%, a difference of 0.050%), South American (7.5%, a difference of 0.070%), and Aleut (7.5%, a difference of 0.10%).
| Demographics | Rating | Rank | Unemployment Among Women with Children Under 6 years |
| Europeans | 79.1 /100 | #144 | Good 7.5% |
| Immigrants | Jordan | 78.9 /100 | #145 | Good 7.5% |
| Japanese | 78.9 /100 | #146 | Good 7.5% |
| Immigrants | Oceania | 78.4 /100 | #147 | Good 7.5% |
| Immigrants | Brazil | 77.3 /100 | #148 | Good 7.5% |
| Colombians | 76.1 /100 | #149 | Good 7.5% |
| Aleuts | 76.0 /100 | #150 | Good 7.5% |
| Immigrants | Peru | 74.9 /100 | #151 | Good 7.5% |
| Bangladeshis | 74.8 /100 | #152 | Good 7.5% |
| Uruguayans | 74.7 /100 | #153 | Good 7.5% |
| Northern Europeans | 74.3 /100 | #154 | Good 7.5% |
| South Americans | 74.1 /100 | #155 | Good 7.5% |
| Immigrants | Southern Europe | 73.2 /100 | #156 | Good 7.5% |
| Peruvians | 72.3 /100 | #157 | Good 7.5% |
| Croatians | 71.9 /100 | #158 | Good 7.5% |
Demographics Similar to Mexican American Indians by Unemployment Among Women with Children Under 6 years
In terms of unemployment among women with children under 6 years, the demographic groups most similar to Mexican American Indians are Slovak (8.5%, a difference of 0.080%), Immigrants from Congo (8.5%, a difference of 0.56%), Immigrants from Senegal (8.5%, a difference of 0.57%), Immigrants from Cameroon (8.6%, a difference of 0.75%), and Immigrants from Latin America (8.6%, a difference of 0.80%).
| Demographics | Rating | Rank | Unemployment Among Women with Children Under 6 years |
| French Canadians | 0.3 /100 | #265 | Tragic 8.4% |
| Immigrants | Honduras | 0.3 /100 | #266 | Tragic 8.4% |
| Belizeans | 0.2 /100 | #267 | Tragic 8.4% |
| Sub-Saharan Africans | 0.2 /100 | #268 | Tragic 8.4% |
| Immigrants | Haiti | 0.2 /100 | #269 | Tragic 8.4% |
| Immigrants | Senegal | 0.2 /100 | #270 | Tragic 8.5% |
| Immigrants | Congo | 0.2 /100 | #271 | Tragic 8.5% |
| Mexican American Indians | 0.1 /100 | #272 | Tragic 8.5% |
| Slovaks | 0.1 /100 | #273 | Tragic 8.5% |
| Immigrants | Cameroon | 0.1 /100 | #274 | Tragic 8.6% |
| Immigrants | Latin America | 0.1 /100 | #275 | Tragic 8.6% |
| Yaqui | 0.0 /100 | #276 | Tragic 8.6% |
| Haitians | 0.0 /100 | #277 | Tragic 8.6% |
| Immigrants | Dominica | 0.0 /100 | #278 | Tragic 8.6% |
| Immigrants | Guatemala | 0.0 /100 | #279 | Tragic 8.6% |