Immigrants from Malaysia vs Cuban Unemployment Among Women with Children Under 6 years

COMPARE

Immigrants from Malaysia
Race
Ancestry
AfghanAfricanAlaska NativeAlaskan AthabascanAlbanianAleutAlsatianAmericanApacheArabArapahoArgentineanArmenianAssyrian/Chaldean/SyriacAustralianAustrianBahamianBangladeshiBarbadianBasqueBelgianBelizeanBermudanBhutaneseBlackfeetBolivianBrazilianBritishBritish West IndianBulgarianBurmeseCajunCambodianCanadianCape VerdeanCarpatho RusynCelticCentral AmericanCentral American IndianCherokeeCheyenneChickasawChileanChineseChippewaChoctawColombianColvilleComancheCosta RicanCreeCreekCroatianCrowCypriotCzechCzechoslovakianDanishDelawareDominicanDutchDutch West IndianEastern EuropeanEcuadorianEgyptianEnglishEstonianEthiopianEuropeanFijianFilipinoFinnishFrenchFrench American IndianFrench CanadianGermanGerman RussianGhanaianGreekGuamanian/ChamorroGuatemalanGuyaneseHaitianHmongHonduranHopiHoumaHungarianIcelanderIndian (Asian)IndonesianInupiatIranianIraqiIrishIroquoisIsraeliItalianJamaicanJapaneseJordanianKenyanKiowaKoreanLaotianLatvianLebaneseLiberianLithuanianLumbeeLuxembourgerMacedonianMalaysianMalteseMarshalleseMenomineeMexicanMexican American IndianMongolianMoroccanNative HawaiianNavajoNepaleseNew ZealanderNicaraguanNigerianNorthern EuropeanNorwegianOkinawanOsageOttawaPaiutePakistaniPalestinianPanamanianParaguayanPennsylvania GermanPeruvianPimaPolishPortuguesePotawatomiPuebloPuerto RicanPuget Sound SalishRomanianRussianSalvadoranSamoanScandinavianScotch-IrishScottishSeminoleSenegaleseSerbianShoshoneSierra LeoneanSiouxSlavicSlovakSloveneSomaliSouth AfricanSouth AmericanSouth American IndianSoviet UnionSpaniardSpanishSpanish AmericanSpanish American IndianSri LankanSubsaharan AfricanSudaneseSwedishSwissSyrianTaiwaneseThaiTlingit-HaidaTohono O'OdhamTonganTrinidadian and TobagonianTsimshianTurkishU.S. Virgin IslanderUgandanUkrainianUruguayanUteVenezuelanVietnameseWelshWest IndianYakamaYaquiYugoslavianYumanYup'ikZimbabwean
Immigration
NonimmigrantsImmigrantsAfghanistanAfricaAlbaniaArgentinaArmeniaAsiaAustraliaAustriaBahamasBangladeshBarbadosBelarusBelgiumBelizeBoliviaBosnia and HerzegovinaBrazilBulgariaBurma/MyanmarCabo VerdeCambodiaCameroonCanadaCaribbeanCentral AmericaChileChinaColombiaCongoCosta RicaCroatiaCubaCzechoslovakiaDenmarkDominicaDominican RepublicEastern AfricaEastern AsiaEastern EuropeEcuadorEgyptEl SalvadorEnglandEritreaEthiopiaEuropeFijiFranceGermanyGhanaGreeceGrenadaGuatemalaGuyanaHaitiHondurasHong KongHungaryIndiaIndonesiaIranIraqIrelandIsraelItalyJamaicaJapanJordanKazakhstanKenyaKoreaKuwaitLaosLatin AmericaLatviaLebanonLiberiaLithuaniaMalaysiaMexicoMicronesiaMiddle AfricaMoldovaMoroccoNepalNetherlandsNicaraguaNigeriaNorth AmericaNorth MacedoniaNorthern AfricaNorthern EuropeNorwayOceaniaPakistanPanamaPeruPhilippinesPolandPortugalRomaniaRussiaSaudi ArabiaScotlandSenegalSerbiaSierra LeoneSingaporeSomaliaSouth AfricaSouth AmericaSouth Central AsiaSouth Eastern AsiaSouthern EuropeSpainSri LankaSt. Vincent and the GrenadinesSudanSwedenSwitzerlandSyriaTaiwanThailandTrinidad and TobagoTurkeyUgandaUkraineUruguayUzbekistanVenezuelaVietnamWest IndiesWestern AfricaWestern AsiaWestern EuropeYemenZaireZimbabweAzores
Cuban
Race
Ancestry
AfghanAfricanAlaska NativeAlaskan AthabascanAlbanianAleutAlsatianAmericanApacheArabArapahoArgentineanArmenianAssyrian/Chaldean/SyriacAustralianAustrianBahamianBangladeshiBarbadianBasqueBelgianBelizeanBermudanBhutaneseBlackfeetBolivianBrazilianBritishBritish West IndianBulgarianBurmeseCajunCambodianCanadianCape VerdeanCarpatho RusynCelticCentral AmericanCentral American IndianCherokeeCheyenneChickasawChileanChineseChippewaChoctawColombianColvilleComancheCosta RicanCreeCreekCroatianCrowCubanCypriotCzechCzechoslovakianDanishDelawareDominicanDutchDutch West IndianEastern EuropeanEcuadorianEgyptianEnglishEstonianEthiopianEuropeanFijianFilipinoFinnishFrenchFrench American IndianFrench CanadianGermanGerman RussianGhanaianGreekGuamanian/ChamorroGuatemalanGuyaneseHaitianHmongHonduranHopiHoumaHungarianIcelanderIndian (Asian)IndonesianInupiatIranianIraqiIrishIroquoisIsraeliItalianJamaicanJapaneseJordanianKenyanKiowaKoreanLaotianLatvianLebaneseLiberianLithuanianLumbeeLuxembourgerMacedonianMalaysianMalteseMarshalleseMenomineeMexicanMexican American IndianMongolianMoroccanNative HawaiianNavajoNepaleseNew ZealanderNicaraguanNigerianNorthern EuropeanNorwegianOkinawanOsageOttawaPaiutePakistaniPalestinianPanamanianParaguayanPennsylvania GermanPeruvianPimaPolishPortuguesePotawatomiPuebloPuerto RicanPuget Sound SalishRomanianRussianSalvadoranSamoanScandinavianScotch-IrishScottishSeminoleSenegaleseSerbianShoshoneSierra LeoneanSiouxSlavicSlovakSloveneSomaliSouth AfricanSouth AmericanSouth American IndianSoviet UnionSpaniardSpanishSpanish AmericanSpanish American IndianSri LankanSubsaharan AfricanSudaneseSwedishSwissSyrianTaiwaneseThaiTlingit-HaidaTohono O'OdhamTonganTrinidadian and TobagonianTsimshianTurkishU.S. Virgin IslanderUgandanUkrainianUruguayanUteVenezuelanVietnameseWelshWest IndianYakamaYaquiYugoslavianYumanYup'ikZimbabwean
Immigration
NonimmigrantsImmigrantsAfghanistanAfricaAlbaniaArgentinaArmeniaAsiaAustraliaAustriaBahamasBangladeshBarbadosBelarusBelgiumBelizeBoliviaBosnia and HerzegovinaBrazilBulgariaBurma/MyanmarCabo VerdeCambodiaCameroonCanadaCaribbeanCentral AmericaChileChinaColombiaCongoCosta RicaCroatiaCubaCzechoslovakiaDenmarkDominicaDominican RepublicEastern AfricaEastern AsiaEastern EuropeEcuadorEgyptEl SalvadorEnglandEritreaEthiopiaEuropeFijiFranceGermanyGhanaGreeceGrenadaGuatemalaGuyanaHaitiHondurasHong KongHungaryIndiaIndonesiaIranIraqIrelandIsraelItalyJamaicaJapanJordanKazakhstanKenyaKoreaKuwaitLaosLatin AmericaLatviaLebanonLiberiaLithuaniaMexicoMicronesiaMiddle AfricaMoldovaMoroccoNepalNetherlandsNicaraguaNigeriaNorth AmericaNorth MacedoniaNorthern AfricaNorthern EuropeNorwayOceaniaPakistanPanamaPeruPhilippinesPolandPortugalRomaniaRussiaSaudi ArabiaScotlandSenegalSerbiaSierra LeoneSingaporeSomaliaSouth AfricaSouth AmericaSouth Central AsiaSouth Eastern AsiaSouthern EuropeSpainSri LankaSt. Vincent and the GrenadinesSudanSwedenSwitzerlandSyriaTaiwanThailandTrinidad and TobagoTurkeyUgandaUkraineUruguayUzbekistanVenezuelaVietnamWest IndiesWestern AfricaWestern AsiaWestern EuropeYemenZaireZimbabweAzores
Unemployment Among Women with Children Under 6 years
Income
Poverty
Unemployment
Labor Participation
Family Structure
Vehicle Availability
Education Level
Disability

Unemployment Among Women with Children Under 6 years Comparison

Immigrants from Malaysia

Cubans

Exceptional
Exceptional
6.4%
UNEMPLOYMENT AMONG WOMEN WITH CHILDREN UNDER 6 YEARS
100.0/ 100
METRIC RATING
17th/ 347
METRIC RANK
7.0%
UNEMPLOYMENT AMONG WOMEN WITH CHILDREN UNDER 6 YEARS
99.4/ 100
METRIC RATING
72nd/ 347
METRIC RANK

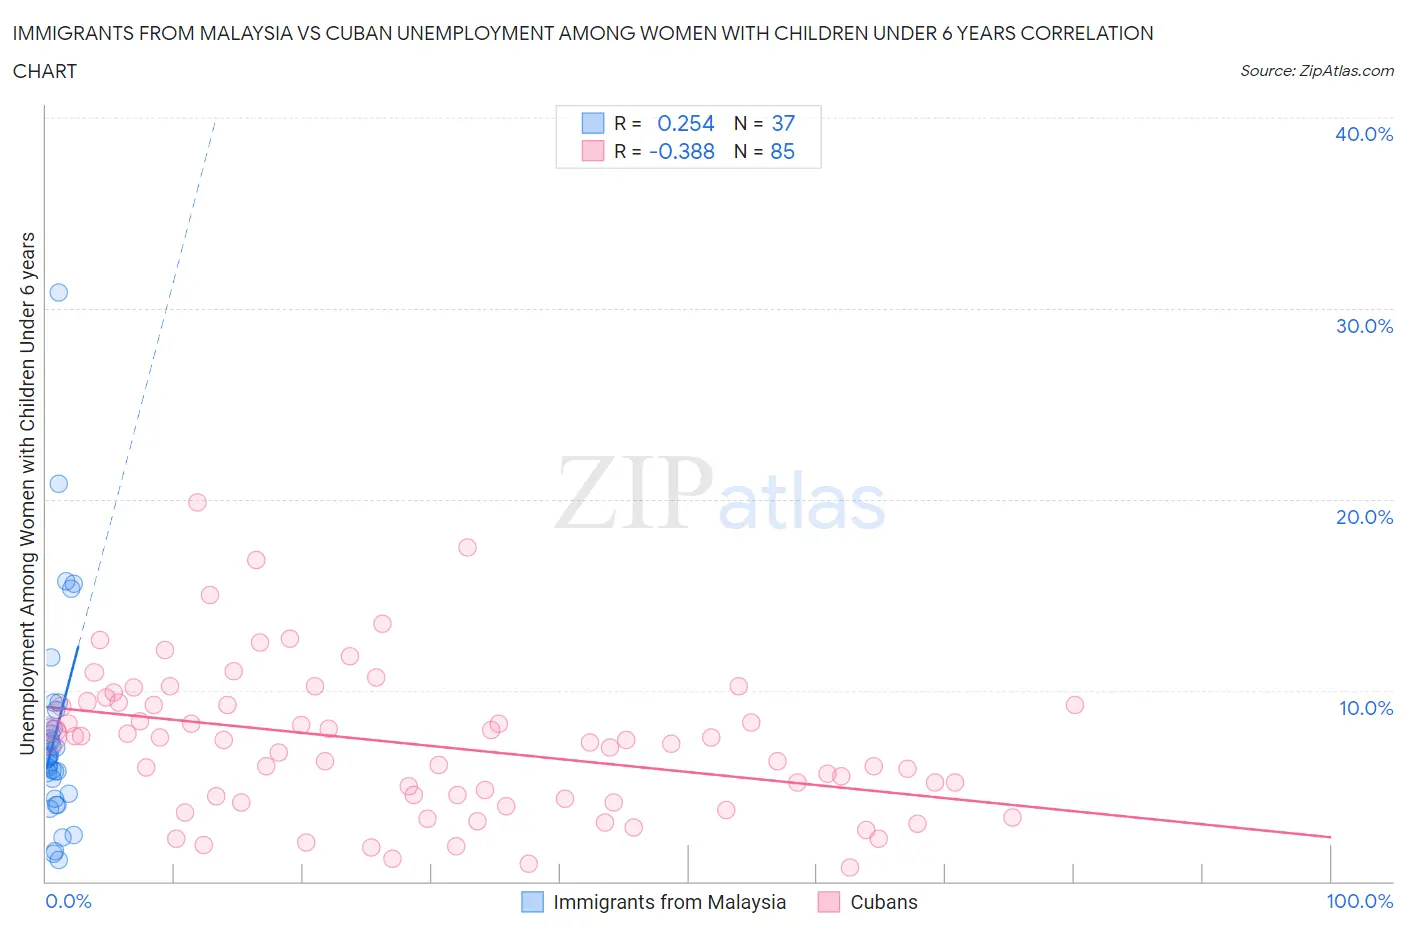
Immigrants from Malaysia vs Cuban Unemployment Among Women with Children Under 6 years Correlation Chart

The statistical analysis conducted on geographies consisting of 169,871,997 people shows a weak positive correlation between the proportion of Immigrants from Malaysia and unemployment rate among women with children under the age of 6 in the United States with a correlation coefficient (R) of 0.254 and weighted average of 6.4%. Similarly, the statistical analysis conducted on geographies consisting of 334,950,414 people shows a mild negative correlation between the proportion of Cubans and unemployment rate among women with children under the age of 6 in the United States with a correlation coefficient (R) of -0.388 and weighted average of 7.0%, a difference of 9.6%.
Immigrants from Malaysia vs Cuban Unemployment Among Women with Children Under 6 years

Unemployment Among Women with Children Under 6 years Correlation Summary

MeasurementImmigrants from MalaysiaCuban
Minimum1.1%0.70%
Maximum30.8%19.8%
Range29.7%19.1%
Mean7.7%7.1%
Median6.5%7.3%
Interquartile 25% (IQ1)4.5%4.2%
Interquartile 75% (IQ3)8.5%9.3%
Interquartile Range (IQR)4.1%5.1%
Standard Deviation (Sample)5.7%3.8%
Standard Deviation (Population)5.7%3.8%

Similar Demographics by Unemployment Among Women with Children Under 6 years

Demographics Similar to Immigrants from Malaysia by Unemployment Among Women with Children Under 6 years

In terms of unemployment among women with children under 6 years, the demographic groups most similar to Immigrants from Malaysia are Immigrants from Uzbekistan (6.3%, a difference of 0.67%), Thai (6.3%, a difference of 0.97%), Assyrian/Chaldean/Syriac (6.5%, a difference of 0.98%), Immigrants from Bulgaria (6.3%, a difference of 1.1%), and Mongolian (6.5%, a difference of 1.3%).
DemographicsRating | RankUnemployment Among Women with Children Under 6 years
Immigrants | China
100.0
/100
|
#10
Exceptional
6.2%
Indians (Asian)
100.0
/100
|
#11
Exceptional
6.3%
Immigrants | Singapore
100.0
/100
|
#12
Exceptional
6.3%
Immigrants | Eastern Asia
100.0
/100
|
#13
Exceptional
6.3%
Immigrants | Bulgaria
100.0
/100
|
#14
Exceptional
6.3%
Thais
100.0
/100
|
#15
Exceptional
6.3%
Immigrants | Uzbekistan
100.0
/100
|
#16
Exceptional
6.3%
Immigrants | Malaysia
100.0
/100
|
#17
Exceptional
6.4%
Assyrians/Chaldeans/Syriacs
100.0
/100
|
#18
Exceptional
6.5%
Mongolians
100.0
/100
|
#19
Exceptional
6.5%
Ute
100.0
/100
|
#20
Exceptional
6.5%
Burmese
100.0
/100
|
#21
Exceptional
6.5%
Immigrants | Korea
100.0
/100
|
#22
Exceptional
6.5%
Bulgarians
100.0
/100
|
#23
Exceptional
6.5%
Laotians
100.0
/100
|
#24
Exceptional
6.5%

Demographics Similar to Cubans by Unemployment Among Women with Children Under 6 years

In terms of unemployment among women with children under 6 years, the demographic groups most similar to Cubans are Afghan (7.0%, a difference of 0.11%), Immigrants from Iraq (7.0%, a difference of 0.13%), Immigrants from Eritrea (7.0%, a difference of 0.14%), Paraguayan (7.0%, a difference of 0.18%), and Immigrants from Netherlands (7.0%, a difference of 0.40%).
DemographicsRating | RankUnemployment Among Women with Children Under 6 years
Immigrants | Kuwait
99.7
/100
|
#65
Exceptional
6.9%
Immigrants | Belgium
99.6
/100
|
#66
Exceptional
6.9%
Immigrants | Netherlands
99.5
/100
|
#67
Exceptional
7.0%
Paraguayans
99.4
/100
|
#68
Exceptional
7.0%
Immigrants | Eritrea
99.4
/100
|
#69
Exceptional
7.0%
Immigrants | Iraq
99.4
/100
|
#70
Exceptional
7.0%
Afghans
99.4
/100
|
#71
Exceptional
7.0%
Cubans
99.4
/100
|
#72
Exceptional
7.0%
Immigrants | Czechoslovakia
99.2
/100
|
#73
Exceptional
7.0%
Turks
99.2
/100
|
#74
Exceptional
7.0%
Immigrants | Eastern Europe
99.0
/100
|
#75
Exceptional
7.1%
Estonians
99.0
/100
|
#76
Exceptional
7.1%
Immigrants | Croatia
98.9
/100
|
#77
Exceptional
7.1%
Immigrants | Somalia
98.9
/100
|
#78
Exceptional
7.1%
Immigrants | Fiji
98.9
/100
|
#79
Exceptional
7.1%