Immigrants from Lithuania vs Alaskan Athabascan Unemployment Among Ages 20 to 24 years
COMPARE
Immigrants from Lithuania
Alaskan Athabascan
Unemployment Among Ages 20 to 24 years
Unemployment Among Ages 20 to 24 years Comparison
Immigrants from Lithuania
Alaskan Athabascans
10.1%
UNEMPLOYMENT AMONG AGES 20 TO 24 YEARS
84.2/ 100
METRIC RATING
130th/ 347
METRIC RANK
11.6%
UNEMPLOYMENT AMONG AGES 20 TO 24 YEARS
0.0/ 100
METRIC RATING
280th/ 347
METRIC RANK
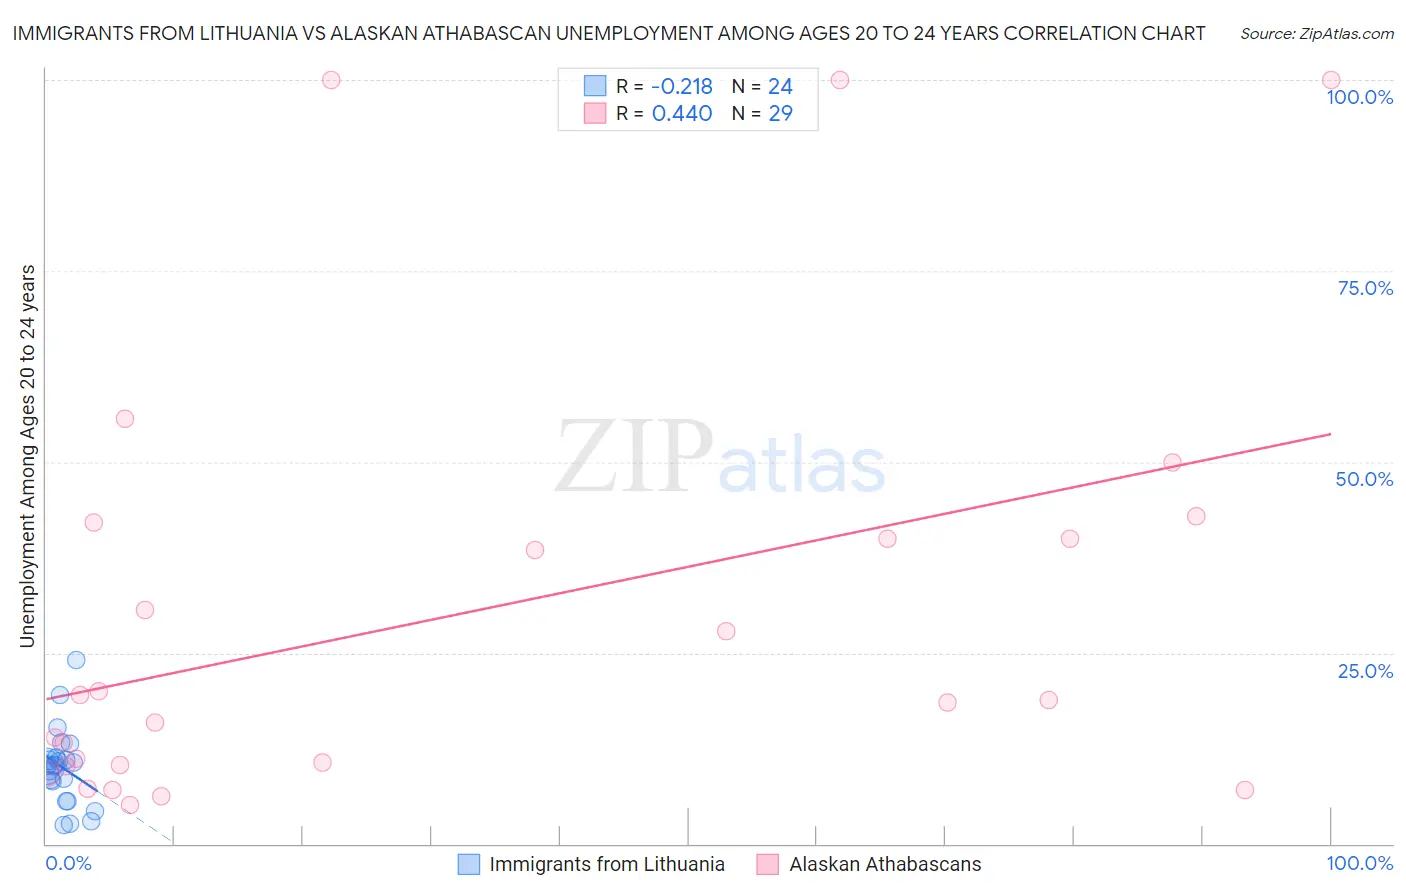
Immigrants from Lithuania vs Alaskan Athabascan Unemployment Among Ages 20 to 24 years Correlation Chart
The statistical analysis conducted on geographies consisting of 116,364,728 people shows a weak negative correlation between the proportion of Immigrants from Lithuania and unemployment rate among population between the ages 20 and 24 in the United States with a correlation coefficient (R) of -0.218 and weighted average of 10.1%. Similarly, the statistical analysis conducted on geographies consisting of 45,208,950 people shows a moderate positive correlation between the proportion of Alaskan Athabascans and unemployment rate among population between the ages 20 and 24 in the United States with a correlation coefficient (R) of 0.440 and weighted average of 11.6%, a difference of 14.5%.
Unemployment Among Ages 20 to 24 years Correlation Summary
| Measurement | Immigrants from Lithuania | Alaskan Athabascan |
| Minimum | 2.5% | 5.0% |
| Maximum | 24.1% | 100.0% |
| Range | 21.6% | 95.0% |
| Mean | 10.0% | 30.0% |
| Median | 10.3% | 18.8% |
| Interquartile 25% (IQ1) | 6.8% | 10.2% |
| Interquartile 75% (IQ3) | 11.1% | 41.1% |
| Interquartile Range (IQR) | 4.3% | 30.9% |
| Standard Deviation (Sample) | 5.0% | 28.2% |
| Standard Deviation (Population) | 4.9% | 27.7% |
Similar Demographics by Unemployment Among Ages 20 to 24 years
Demographics Similar to Immigrants from Lithuania by Unemployment Among Ages 20 to 24 years
In terms of unemployment among ages 20 to 24 years, the demographic groups most similar to Immigrants from Lithuania are Seminole (10.1%, a difference of 0.0%), Immigrants from South Eastern Asia (10.1%, a difference of 0.010%), Austrian (10.2%, a difference of 0.020%), Immigrants from South Central Asia (10.1%, a difference of 0.030%), and Romanian (10.2%, a difference of 0.030%).
| Demographics | Rating | Rank | Unemployment Among Ages 20 to 24 years |
| Immigrants | Iraq | 87.1 /100 | #123 | Excellent 10.1% |
| Immigrants | Japan | 86.5 /100 | #124 | Excellent 10.1% |
| Spanish | 86.1 /100 | #125 | Excellent 10.1% |
| Jordanians | 86.1 /100 | #126 | Excellent 10.1% |
| Immigrants | Norway | 85.3 /100 | #127 | Excellent 10.1% |
| Immigrants | Brazil | 84.9 /100 | #128 | Excellent 10.1% |
| Immigrants | South Central Asia | 84.6 /100 | #129 | Excellent 10.1% |
| Immigrants | Lithuania | 84.2 /100 | #130 | Excellent 10.1% |
| Seminole | 84.2 /100 | #131 | Excellent 10.1% |
| Immigrants | South Eastern Asia | 84.0 /100 | #132 | Excellent 10.1% |
| Austrians | 83.9 /100 | #133 | Excellent 10.2% |
| Romanians | 83.8 /100 | #134 | Excellent 10.2% |
| Comanche | 83.4 /100 | #135 | Excellent 10.2% |
| Immigrants | Northern Africa | 82.5 /100 | #136 | Excellent 10.2% |
| Immigrants | North America | 82.5 /100 | #137 | Excellent 10.2% |
Demographics Similar to Alaskan Athabascans by Unemployment Among Ages 20 to 24 years
In terms of unemployment among ages 20 to 24 years, the demographic groups most similar to Alaskan Athabascans are Bahamian (11.6%, a difference of 0.35%), Armenian (11.7%, a difference of 0.47%), Colville (11.6%, a difference of 0.60%), Immigrants from Cameroon (11.7%, a difference of 0.62%), and African (11.5%, a difference of 0.63%).
| Demographics | Rating | Rank | Unemployment Among Ages 20 to 24 years |
| Immigrants | Nigeria | 0.0 /100 | #273 | Tragic 11.5% |
| Cape Verdeans | 0.0 /100 | #274 | Tragic 11.5% |
| Senegalese | 0.0 /100 | #275 | Tragic 11.5% |
| Sierra Leoneans | 0.0 /100 | #276 | Tragic 11.5% |
| Africans | 0.0 /100 | #277 | Tragic 11.5% |
| Colville | 0.0 /100 | #278 | Tragic 11.6% |
| Bahamians | 0.0 /100 | #279 | Tragic 11.6% |
| Alaskan Athabascans | 0.0 /100 | #280 | Tragic 11.6% |
| Armenians | 0.0 /100 | #281 | Tragic 11.7% |
| Immigrants | Cameroon | 0.0 /100 | #282 | Tragic 11.7% |
| Ghanaians | 0.0 /100 | #283 | Tragic 11.7% |
| Immigrants | Western Africa | 0.0 /100 | #284 | Tragic 11.7% |
| Soviet Union | 0.0 /100 | #285 | Tragic 11.7% |
| Ecuadorians | 0.0 /100 | #286 | Tragic 11.8% |
| Immigrants | Ecuador | 0.0 /100 | #287 | Tragic 11.8% |