Immigrants from Latin America vs U.S. Virgin Islander Unemployment Among Ages 55 to 59 years

COMPARE

Immigrants from Latin America
Race
Ancestry
AfghanAfricanAlaska NativeAlaskan AthabascanAlbanianAleutAlsatianAmericanApacheArabArapahoArgentineanArmenianAssyrian/Chaldean/SyriacAustralianAustrianBahamianBangladeshiBarbadianBasqueBelgianBelizeanBermudanBhutaneseBlackfeetBolivianBrazilianBritishBritish West IndianBulgarianBurmeseCajunCambodianCanadianCape VerdeanCarpatho RusynCelticCentral AmericanCentral American IndianCherokeeCheyenneChickasawChileanChineseChippewaChoctawColombianColvilleComancheCosta RicanCreeCreekCroatianCrowCubanCypriotCzechCzechoslovakianDanishDelawareDominicanDutchDutch West IndianEastern EuropeanEcuadorianEgyptianEnglishEstonianEthiopianEuropeanFijianFilipinoFinnishFrenchFrench American IndianFrench CanadianGermanGerman RussianGhanaianGreekGuamanian/ChamorroGuatemalanGuyaneseHaitianHmongHonduranHopiHoumaHungarianIcelanderIndian (Asian)IndonesianInupiatIranianIraqiIrishIroquoisIsraeliItalianJamaicanJapaneseJordanianKenyanKiowaKoreanLaotianLatvianLebaneseLiberianLithuanianLumbeeLuxembourgerMacedonianMalaysianMalteseMarshalleseMenomineeMexicanMexican American IndianMongolianMoroccanNative HawaiianNavajoNepaleseNew ZealanderNicaraguanNigerianNorthern EuropeanNorwegianOkinawanOsageOttawaPaiutePakistaniPalestinianPanamanianParaguayanPennsylvania GermanPeruvianPimaPolishPortuguesePotawatomiPuebloPuerto RicanPuget Sound SalishRomanianRussianSalvadoranSamoanScandinavianScotch-IrishScottishSeminoleSenegaleseSerbianShoshoneSierra LeoneanSiouxSlavicSlovakSloveneSomaliSouth AfricanSouth AmericanSouth American IndianSoviet UnionSpaniardSpanishSpanish AmericanSpanish American IndianSri LankanSubsaharan AfricanSudaneseSwedishSwissSyrianTaiwaneseThaiTlingit-HaidaTohono O'OdhamTonganTrinidadian and TobagonianTsimshianTurkishUgandanUkrainianUruguayanUteVenezuelanVietnameseWelshWest IndianYakamaYaquiYugoslavianYumanYup'ikZimbabwean
Immigration
NonimmigrantsImmigrantsAfghanistanAfricaAlbaniaArgentinaArmeniaAsiaAustraliaAustriaBahamasBangladeshBarbadosBelarusBelgiumBelizeBoliviaBosnia and HerzegovinaBrazilBulgariaBurma/MyanmarCabo VerdeCambodiaCameroonCanadaCaribbeanCentral AmericaChileChinaColombiaCongoCosta RicaCroatiaCubaCzechoslovakiaDenmarkDominicaDominican RepublicEastern AfricaEastern AsiaEastern EuropeEcuadorEgyptEl SalvadorEnglandEritreaEthiopiaEuropeFijiFranceGermanyGhanaGreeceGrenadaGuatemalaGuyanaHaitiHondurasHong KongHungaryIndiaIndonesiaIranIraqIrelandIsraelItalyJamaicaJapanJordanKazakhstanKenyaKoreaKuwaitLaosLatin AmericaLatviaLebanonLiberiaLithuaniaMalaysiaMexicoMicronesiaMiddle AfricaMoldovaMoroccoNepalNetherlandsNicaraguaNigeriaNorth AmericaNorth MacedoniaNorthern AfricaNorthern EuropeNorwayOceaniaPakistanPanamaPeruPhilippinesPolandPortugalRomaniaRussiaSaudi ArabiaScotlandSenegalSerbiaSierra LeoneSingaporeSomaliaSouth AfricaSouth AmericaSouth Central AsiaSouth Eastern AsiaSouthern EuropeSpainSri LankaSt. Vincent and the GrenadinesSudanSwedenSwitzerlandSyriaTaiwanThailandTrinidad and TobagoTurkeyUgandaUkraineUruguayUzbekistanVenezuelaVietnamWest IndiesWestern AfricaWestern AsiaWestern EuropeYemenZaireZimbabweAzores
U.S. Virgin Islander
Race
Ancestry
AfghanAfricanAlaska NativeAlaskan AthabascanAlbanianAleutAlsatianAmericanApacheArabArapahoArgentineanArmenianAssyrian/Chaldean/SyriacAustralianAustrianBahamianBangladeshiBarbadianBasqueBelgianBelizeanBermudanBhutaneseBlackfeetBolivianBrazilianBritishBritish West IndianBulgarianBurmeseCajunCambodianCanadianCape VerdeanCarpatho RusynCelticCentral AmericanCentral American IndianCherokeeCheyenneChickasawChileanChineseChippewaChoctawColombianColvilleComancheCosta RicanCreeCreekCroatianCrowCubanCypriotCzechCzechoslovakianDanishDelawareDominicanDutchDutch West IndianEastern EuropeanEcuadorianEgyptianEnglishEstonianEthiopianEuropeanFijianFilipinoFinnishFrenchFrench American IndianFrench CanadianGermanGerman RussianGhanaianGreekGuamanian/ChamorroGuatemalanGuyaneseHaitianHmongHonduranHopiHoumaHungarianIcelanderIndian (Asian)IndonesianInupiatIranianIraqiIrishIroquoisIsraeliItalianJamaicanJapaneseJordanianKenyanKiowaKoreanLaotianLatvianLebaneseLiberianLithuanianLumbeeLuxembourgerMacedonianMalaysianMalteseMarshalleseMenomineeMexicanMexican American IndianMongolianMoroccanNative HawaiianNavajoNepaleseNew ZealanderNicaraguanNigerianNorthern EuropeanNorwegianOkinawanOsageOttawaPaiutePakistaniPalestinianPanamanianParaguayanPennsylvania GermanPeruvianPimaPolishPortuguesePotawatomiPuebloPuerto RicanPuget Sound SalishRomanianRussianSalvadoranSamoanScandinavianScotch-IrishScottishSeminoleSenegaleseSerbianShoshoneSierra LeoneanSiouxSlavicSlovakSloveneSomaliSouth AfricanSouth AmericanSouth American IndianSoviet UnionSpaniardSpanishSpanish AmericanSpanish American IndianSri LankanSubsaharan AfricanSudaneseSwedishSwissSyrianTaiwaneseThaiTlingit-HaidaTohono O'OdhamTonganTrinidadian and TobagonianTsimshianTurkishU.S. Virgin IslanderUgandanUkrainianUruguayanUteVenezuelanVietnameseWelshWest IndianYakamaYaquiYugoslavianYumanYup'ikZimbabwean
Immigration
NonimmigrantsImmigrantsAfghanistanAfricaAlbaniaArgentinaArmeniaAsiaAustraliaAustriaBahamasBangladeshBarbadosBelarusBelgiumBelizeBoliviaBosnia and HerzegovinaBrazilBulgariaBurma/MyanmarCabo VerdeCambodiaCameroonCanadaCaribbeanCentral AmericaChileChinaColombiaCongoCosta RicaCroatiaCubaCzechoslovakiaDenmarkDominicaDominican RepublicEastern AfricaEastern AsiaEastern EuropeEcuadorEgyptEl SalvadorEnglandEritreaEthiopiaEuropeFijiFranceGermanyGhanaGreeceGrenadaGuatemalaGuyanaHaitiHondurasHong KongHungaryIndiaIndonesiaIranIraqIrelandIsraelItalyJamaicaJapanJordanKazakhstanKenyaKoreaKuwaitLaosLatviaLebanonLiberiaLithuaniaMalaysiaMexicoMicronesiaMiddle AfricaMoldovaMoroccoNepalNetherlandsNicaraguaNigeriaNorth AmericaNorth MacedoniaNorthern AfricaNorthern EuropeNorwayOceaniaPakistanPanamaPeruPhilippinesPolandPortugalRomaniaRussiaSaudi ArabiaScotlandSenegalSerbiaSierra LeoneSingaporeSomaliaSouth AfricaSouth AmericaSouth Central AsiaSouth Eastern AsiaSouthern EuropeSpainSri LankaSt. Vincent and the GrenadinesSudanSwedenSwitzerlandSyriaTaiwanThailandTrinidad and TobagoTurkeyUgandaUkraineUruguayUzbekistanVenezuelaVietnamWest IndiesWestern AfricaWestern AsiaWestern EuropeYemenZaireZimbabweAzores
Unemployment Among Ages 55 to 59 years
Income
Poverty
Unemployment
Labor Participation
Family Structure
Vehicle Availability
Education Level
Disability

Unemployment Among Ages 55 to 59 years Comparison

Immigrants from Latin America

U.S. Virgin Islanders

Tragic
Tragic
5.2%
UNEMPLOYMENT AMONG AGES 55 TO 59 YEARS
0.0/ 100
METRIC RATING
277th/ 347
METRIC RANK
5.1%
UNEMPLOYMENT AMONG AGES 55 TO 59 YEARS
0.3/ 100
METRIC RATING
252nd/ 347
METRIC RANK

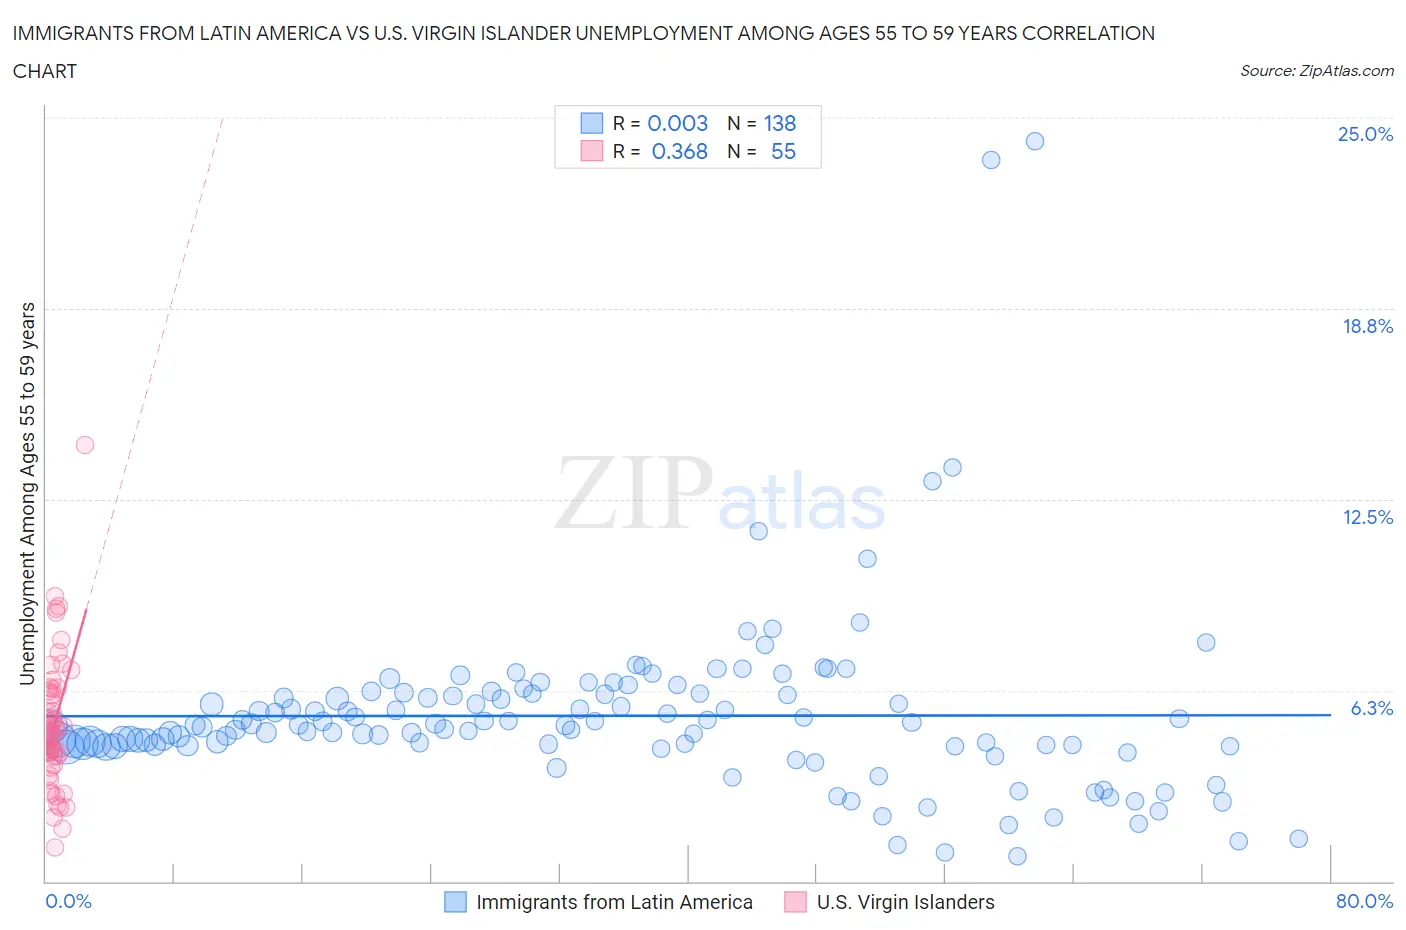
Immigrants from Latin America vs U.S. Virgin Islander Unemployment Among Ages 55 to 59 years Correlation Chart

The statistical analysis conducted on geographies consisting of 483,849,302 people shows no correlation between the proportion of Immigrants from Latin America and unemployment rate among population between the ages 55 and 59 in the United States with a correlation coefficient (R) of 0.003 and weighted average of 5.2%. Similarly, the statistical analysis conducted on geographies consisting of 85,764,449 people shows a mild positive correlation between the proportion of U.S. Virgin Islanders and unemployment rate among population between the ages 55 and 59 in the United States with a correlation coefficient (R) of 0.368 and weighted average of 5.1%, a difference of 2.6%.
Immigrants from Latin America vs U.S. Virgin Islander Unemployment Among Ages 55 to 59 years

Unemployment Among Ages 55 to 59 years Correlation Summary

MeasurementImmigrants from Latin AmericaU.S. Virgin Islander
Minimum0.80%1.1%
Maximum24.2%14.3%
Range23.4%13.2%
Mean5.4%5.1%
Median5.1%4.9%
Interquartile 25% (IQ1)4.4%3.8%
Interquartile 75% (IQ3)6.1%6.3%
Interquartile Range (IQR)1.7%2.5%
Standard Deviation (Sample)3.0%2.3%
Standard Deviation (Population)3.0%2.2%

Similar Demographics by Unemployment Among Ages 55 to 59 years

Demographics Similar to Immigrants from Latin America by Unemployment Among Ages 55 to 59 years

In terms of unemployment among ages 55 to 59 years, the demographic groups most similar to Immigrants from Latin America are West Indian (5.2%, a difference of 0.12%), Israeli (5.2%, a difference of 0.13%), Immigrants from Barbados (5.2%, a difference of 0.18%), Mexican American Indian (5.2%, a difference of 0.23%), and Alsatian (5.2%, a difference of 0.29%).
DemographicsRating | RankUnemployment Among Ages 55 to 59 years
Ute
0.1
/100
|
#270
Tragic
5.2%
Cree
0.1
/100
|
#271
Tragic
5.2%
Immigrants | Jamaica
0.0
/100
|
#272
Tragic
5.2%
Ottawa
0.0
/100
|
#273
Tragic
5.2%
Mexican American Indians
0.0
/100
|
#274
Tragic
5.2%
Israelis
0.0
/100
|
#275
Tragic
5.2%
West Indians
0.0
/100
|
#276
Tragic
5.2%
Immigrants | Latin America
0.0
/100
|
#277
Tragic
5.2%
Immigrants | Barbados
0.0
/100
|
#278
Tragic
5.2%
Alsatians
0.0
/100
|
#279
Tragic
5.2%
Immigrants | Uzbekistan
0.0
/100
|
#280
Tragic
5.3%
Guatemalans
0.0
/100
|
#281
Tragic
5.3%
Immigrants | Trinidad and Tobago
0.0
/100
|
#282
Tragic
5.3%
Apache
0.0
/100
|
#283
Tragic
5.3%
Ghanaians
0.0
/100
|
#284
Tragic
5.3%

Demographics Similar to U.S. Virgin Islanders by Unemployment Among Ages 55 to 59 years

In terms of unemployment among ages 55 to 59 years, the demographic groups most similar to U.S. Virgin Islanders are Portuguese (5.1%, a difference of 0.020%), Paraguayan (5.1%, a difference of 0.040%), Seminole (5.1%, a difference of 0.070%), Cheyenne (5.1%, a difference of 0.090%), and Blackfeet (5.1%, a difference of 0.14%).
DemographicsRating | RankUnemployment Among Ages 55 to 59 years
Soviet Union
0.6
/100
|
#245
Tragic
5.1%
Immigrants | Greece
0.6
/100
|
#246
Tragic
5.1%
Immigrants | Honduras
0.5
/100
|
#247
Tragic
5.1%
Native Hawaiians
0.5
/100
|
#248
Tragic
5.1%
Comanche
0.4
/100
|
#249
Tragic
5.1%
Cheyenne
0.4
/100
|
#250
Tragic
5.1%
Portuguese
0.3
/100
|
#251
Tragic
5.1%
U.S. Virgin Islanders
0.3
/100
|
#252
Tragic
5.1%
Paraguayans
0.3
/100
|
#253
Tragic
5.1%
Seminole
0.3
/100
|
#254
Tragic
5.1%
Blackfeet
0.3
/100
|
#255
Tragic
5.1%
Senegalese
0.3
/100
|
#256
Tragic
5.1%
Central Americans
0.2
/100
|
#257
Tragic
5.1%
Salvadorans
0.2
/100
|
#258
Tragic
5.1%
Immigrants | West Indies
0.2
/100
|
#259
Tragic
5.1%