Immigrants from Latin America vs Immigrants from Cuba Unemployment Among Ages 55 to 59 years

COMPARE

Immigrants from Latin America
Race
Ancestry
AfghanAfricanAlaska NativeAlaskan AthabascanAlbanianAleutAlsatianAmericanApacheArabArapahoArgentineanArmenianAssyrian/Chaldean/SyriacAustralianAustrianBahamianBangladeshiBarbadianBasqueBelgianBelizeanBermudanBhutaneseBlackfeetBolivianBrazilianBritishBritish West IndianBulgarianBurmeseCajunCambodianCanadianCape VerdeanCarpatho RusynCelticCentral AmericanCentral American IndianCherokeeCheyenneChickasawChileanChineseChippewaChoctawColombianColvilleComancheCosta RicanCreeCreekCroatianCrowCubanCypriotCzechCzechoslovakianDanishDelawareDominicanDutchDutch West IndianEastern EuropeanEcuadorianEgyptianEnglishEstonianEthiopianEuropeanFijianFilipinoFinnishFrenchFrench American IndianFrench CanadianGermanGerman RussianGhanaianGreekGuamanian/ChamorroGuatemalanGuyaneseHaitianHmongHonduranHopiHoumaHungarianIcelanderIndian (Asian)IndonesianInupiatIranianIraqiIrishIroquoisIsraeliItalianJamaicanJapaneseJordanianKenyanKiowaKoreanLaotianLatvianLebaneseLiberianLithuanianLumbeeLuxembourgerMacedonianMalaysianMalteseMarshalleseMenomineeMexicanMexican American IndianMongolianMoroccanNative HawaiianNavajoNepaleseNew ZealanderNicaraguanNigerianNorthern EuropeanNorwegianOkinawanOsageOttawaPaiutePakistaniPalestinianPanamanianParaguayanPennsylvania GermanPeruvianPimaPolishPortuguesePotawatomiPuebloPuerto RicanPuget Sound SalishRomanianRussianSalvadoranSamoanScandinavianScotch-IrishScottishSeminoleSenegaleseSerbianShoshoneSierra LeoneanSiouxSlavicSlovakSloveneSomaliSouth AfricanSouth AmericanSouth American IndianSoviet UnionSpaniardSpanishSpanish AmericanSpanish American IndianSri LankanSubsaharan AfricanSudaneseSwedishSwissSyrianTaiwaneseThaiTlingit-HaidaTohono O'OdhamTonganTrinidadian and TobagonianTsimshianTurkishU.S. Virgin IslanderUgandanUkrainianUruguayanUteVenezuelanVietnameseWelshWest IndianYakamaYaquiYugoslavianYumanYup'ikZimbabwean
Immigration
NonimmigrantsImmigrantsAfghanistanAfricaAlbaniaArgentinaArmeniaAsiaAustraliaAustriaBahamasBangladeshBarbadosBelarusBelgiumBelizeBoliviaBosnia and HerzegovinaBrazilBulgariaBurma/MyanmarCabo VerdeCambodiaCameroonCanadaCaribbeanCentral AmericaChileChinaColombiaCongoCosta RicaCroatiaCzechoslovakiaDenmarkDominicaDominican RepublicEastern AfricaEastern AsiaEastern EuropeEcuadorEgyptEl SalvadorEnglandEritreaEthiopiaEuropeFijiFranceGermanyGhanaGreeceGrenadaGuatemalaGuyanaHaitiHondurasHong KongHungaryIndiaIndonesiaIranIraqIrelandIsraelItalyJamaicaJapanJordanKazakhstanKenyaKoreaKuwaitLaosLatin AmericaLatviaLebanonLiberiaLithuaniaMalaysiaMexicoMicronesiaMiddle AfricaMoldovaMoroccoNepalNetherlandsNicaraguaNigeriaNorth AmericaNorth MacedoniaNorthern AfricaNorthern EuropeNorwayOceaniaPakistanPanamaPeruPhilippinesPolandPortugalRomaniaRussiaSaudi ArabiaScotlandSenegalSerbiaSierra LeoneSingaporeSomaliaSouth AfricaSouth AmericaSouth Central AsiaSouth Eastern AsiaSouthern EuropeSpainSri LankaSt. Vincent and the GrenadinesSudanSwedenSwitzerlandSyriaTaiwanThailandTrinidad and TobagoTurkeyUgandaUkraineUruguayUzbekistanVenezuelaVietnamWest IndiesWestern AfricaWestern AsiaWestern EuropeYemenZaireZimbabweAzores
Immigrants from Cuba
Race
Ancestry
AfghanAfricanAlaska NativeAlaskan AthabascanAlbanianAleutAlsatianAmericanApacheArabArapahoArgentineanArmenianAssyrian/Chaldean/SyriacAustralianAustrianBahamianBangladeshiBarbadianBasqueBelgianBelizeanBermudanBhutaneseBlackfeetBolivianBrazilianBritishBritish West IndianBulgarianBurmeseCajunCambodianCanadianCape VerdeanCarpatho RusynCelticCentral AmericanCentral American IndianCherokeeCheyenneChickasawChileanChineseChippewaChoctawColombianColvilleComancheCosta RicanCreeCreekCroatianCrowCubanCypriotCzechCzechoslovakianDanishDelawareDominicanDutchDutch West IndianEastern EuropeanEcuadorianEgyptianEnglishEstonianEthiopianEuropeanFijianFilipinoFinnishFrenchFrench American IndianFrench CanadianGermanGerman RussianGhanaianGreekGuamanian/ChamorroGuatemalanGuyaneseHaitianHmongHonduranHopiHoumaHungarianIcelanderIndian (Asian)IndonesianInupiatIranianIraqiIrishIroquoisIsraeliItalianJamaicanJapaneseJordanianKenyanKiowaKoreanLaotianLatvianLebaneseLiberianLithuanianLumbeeLuxembourgerMacedonianMalaysianMalteseMarshalleseMenomineeMexicanMexican American IndianMongolianMoroccanNative HawaiianNavajoNepaleseNew ZealanderNicaraguanNigerianNorthern EuropeanNorwegianOkinawanOsageOttawaPaiutePakistaniPalestinianPanamanianParaguayanPennsylvania GermanPeruvianPimaPolishPortuguesePotawatomiPuebloPuerto RicanPuget Sound SalishRomanianRussianSalvadoranSamoanScandinavianScotch-IrishScottishSeminoleSenegaleseSerbianShoshoneSierra LeoneanSiouxSlavicSlovakSloveneSomaliSouth AfricanSouth AmericanSouth American IndianSoviet UnionSpaniardSpanishSpanish AmericanSpanish American IndianSri LankanSubsaharan AfricanSudaneseSwedishSwissSyrianTaiwaneseThaiTlingit-HaidaTohono O'OdhamTonganTrinidadian and TobagonianTsimshianTurkishU.S. Virgin IslanderUgandanUkrainianUruguayanUteVenezuelanVietnameseWelshWest IndianYakamaYaquiYugoslavianYumanYup'ikZimbabwean
Immigration
NonimmigrantsImmigrantsAfghanistanAfricaAlbaniaArgentinaArmeniaAsiaAustraliaAustriaBahamasBangladeshBarbadosBelarusBelgiumBelizeBoliviaBosnia and HerzegovinaBrazilBulgariaBurma/MyanmarCabo VerdeCambodiaCameroonCanadaCaribbeanCentral AmericaChileChinaColombiaCongoCosta RicaCroatiaCubaCzechoslovakiaDenmarkDominicaDominican RepublicEastern AfricaEastern AsiaEastern EuropeEcuadorEgyptEl SalvadorEnglandEritreaEthiopiaEuropeFijiFranceGermanyGhanaGreeceGrenadaGuatemalaGuyanaHaitiHondurasHong KongHungaryIndiaIndonesiaIranIraqIrelandIsraelItalyJamaicaJapanJordanKazakhstanKenyaKoreaKuwaitLaosLatviaLebanonLiberiaLithuaniaMalaysiaMexicoMicronesiaMiddle AfricaMoldovaMoroccoNepalNetherlandsNicaraguaNigeriaNorth AmericaNorth MacedoniaNorthern AfricaNorthern EuropeNorwayOceaniaPakistanPanamaPeruPhilippinesPolandPortugalRomaniaRussiaSaudi ArabiaScotlandSenegalSerbiaSierra LeoneSingaporeSomaliaSouth AfricaSouth AmericaSouth Central AsiaSouth Eastern AsiaSouthern EuropeSpainSri LankaSt. Vincent and the GrenadinesSudanSwedenSwitzerlandSyriaTaiwanThailandTrinidad and TobagoTurkeyUgandaUkraineUruguayUzbekistanVenezuelaVietnamWest IndiesWestern AfricaWestern AsiaWestern EuropeYemenZaireZimbabweAzores
Unemployment Among Ages 55 to 59 years
Income
Poverty
Unemployment
Labor Participation
Family Structure
Vehicle Availability
Education Level
Disability

Unemployment Among Ages 55 to 59 years Comparison

Immigrants from Latin America

Immigrants from Cuba

Tragic
Exceptional
5.2%
UNEMPLOYMENT AMONG AGES 55 TO 59 YEARS
0.0/ 100
METRIC RATING
277th/ 347
METRIC RANK
4.1%
UNEMPLOYMENT AMONG AGES 55 TO 59 YEARS
100.0/ 100
METRIC RATING
2nd/ 347
METRIC RANK

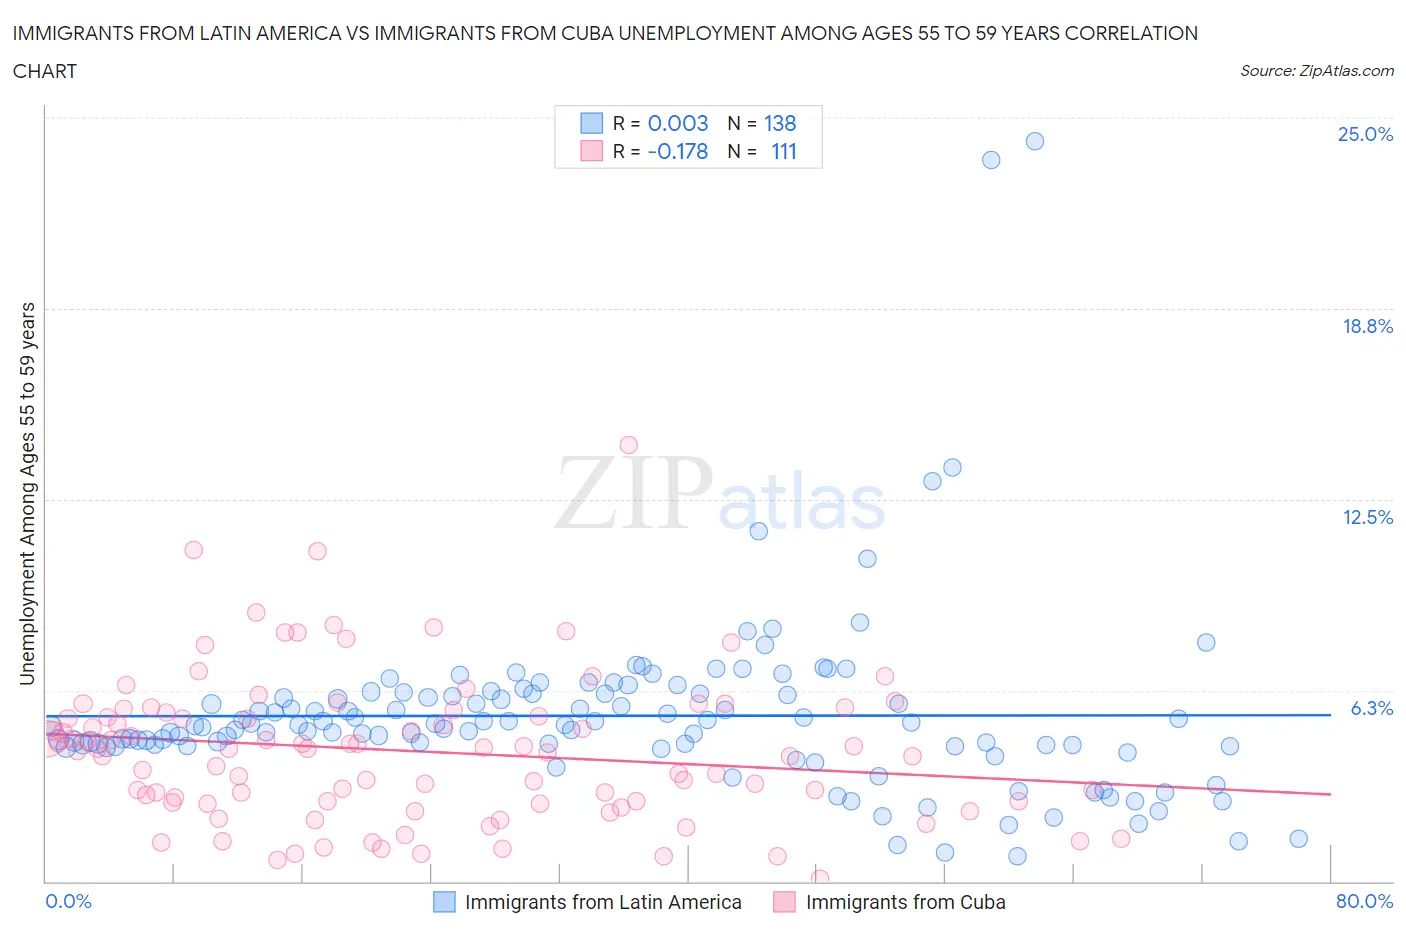
Immigrants from Latin America vs Immigrants from Cuba Unemployment Among Ages 55 to 59 years Correlation Chart

The statistical analysis conducted on geographies consisting of 483,849,302 people shows no correlation between the proportion of Immigrants from Latin America and unemployment rate among population between the ages 55 and 59 in the United States with a correlation coefficient (R) of 0.003 and weighted average of 5.2%. Similarly, the statistical analysis conducted on geographies consisting of 308,279,945 people shows a poor negative correlation between the proportion of Immigrants from Cuba and unemployment rate among population between the ages 55 and 59 in the United States with a correlation coefficient (R) of -0.178 and weighted average of 4.1%, a difference of 28.1%.
Immigrants from Latin America vs Immigrants from Cuba Unemployment Among Ages 55 to 59 years

Unemployment Among Ages 55 to 59 years Correlation Summary

MeasurementImmigrants from Latin AmericaImmigrants from Cuba
Minimum0.80%0.10%
Maximum24.2%14.3%
Range23.4%14.2%
Mean5.4%4.3%
Median5.1%4.3%
Interquartile 25% (IQ1)4.4%2.6%
Interquartile 75% (IQ3)6.1%5.5%
Interquartile Range (IQR)1.7%3.0%
Standard Deviation (Sample)3.0%2.4%
Standard Deviation (Population)3.0%2.4%

Similar Demographics by Unemployment Among Ages 55 to 59 years

Demographics Similar to Immigrants from Latin America by Unemployment Among Ages 55 to 59 years

In terms of unemployment among ages 55 to 59 years, the demographic groups most similar to Immigrants from Latin America are West Indian (5.2%, a difference of 0.12%), Israeli (5.2%, a difference of 0.13%), Immigrants from Barbados (5.2%, a difference of 0.18%), Mexican American Indian (5.2%, a difference of 0.23%), and Alsatian (5.2%, a difference of 0.29%).
DemographicsRating | RankUnemployment Among Ages 55 to 59 years
Ute
0.1
/100
|
#270
Tragic
5.2%
Cree
0.1
/100
|
#271
Tragic
5.2%
Immigrants | Jamaica
0.0
/100
|
#272
Tragic
5.2%
Ottawa
0.0
/100
|
#273
Tragic
5.2%
Mexican American Indians
0.0
/100
|
#274
Tragic
5.2%
Israelis
0.0
/100
|
#275
Tragic
5.2%
West Indians
0.0
/100
|
#276
Tragic
5.2%
Immigrants | Latin America
0.0
/100
|
#277
Tragic
5.2%
Immigrants | Barbados
0.0
/100
|
#278
Tragic
5.2%
Alsatians
0.0
/100
|
#279
Tragic
5.2%
Immigrants | Uzbekistan
0.0
/100
|
#280
Tragic
5.3%
Guatemalans
0.0
/100
|
#281
Tragic
5.3%
Immigrants | Trinidad and Tobago
0.0
/100
|
#282
Tragic
5.3%
Apache
0.0
/100
|
#283
Tragic
5.3%
Ghanaians
0.0
/100
|
#284
Tragic
5.3%

Demographics Similar to Immigrants from Cuba by Unemployment Among Ages 55 to 59 years

In terms of unemployment among ages 55 to 59 years, the demographic groups most similar to Immigrants from Cuba are Immigrants from Venezuela (4.1%, a difference of 0.0%), Fijian (4.1%, a difference of 0.31%), Venezuelan (4.2%, a difference of 1.9%), Immigrants from Bolivia (4.2%, a difference of 2.5%), and Norwegian (4.2%, a difference of 3.0%).
DemographicsRating | RankUnemployment Among Ages 55 to 59 years
Fijians
100.0
/100
|
#1
Exceptional
4.1%
Immigrants | Cuba
100.0
/100
|
#2
Exceptional
4.1%
Immigrants | Venezuela
100.0
/100
|
#3
Exceptional
4.1%
Venezuelans
100.0
/100
|
#4
Exceptional
4.2%
Immigrants | Bolivia
100.0
/100
|
#5
Exceptional
4.2%
Norwegians
100.0
/100
|
#6
Exceptional
4.2%
Zimbabweans
100.0
/100
|
#7
Exceptional
4.2%
Bolivians
100.0
/100
|
#8
Exceptional
4.2%
Cubans
100.0
/100
|
#9
Exceptional
4.2%
Tongans
100.0
/100
|
#10
Exceptional
4.3%
Immigrants | Congo
100.0
/100
|
#11
Exceptional
4.3%
Danes
100.0
/100
|
#12
Exceptional
4.3%
Indonesians
100.0
/100
|
#13
Exceptional
4.3%
Immigrants | India
100.0
/100
|
#14
Exceptional
4.3%
Bulgarians
100.0
/100
|
#15
Exceptional
4.3%