Immigrants from Korea vs Chinese Unemployment Among Ages 45 to 54 years

COMPARE

Immigrants from Korea
Race
Ancestry
AfghanAfricanAlaska NativeAlaskan AthabascanAlbanianAleutAlsatianAmericanApacheArabArapahoArgentineanArmenianAssyrian/Chaldean/SyriacAustralianAustrianBahamianBangladeshiBarbadianBasqueBelgianBelizeanBermudanBhutaneseBlackfeetBolivianBrazilianBritishBritish West IndianBulgarianBurmeseCajunCambodianCanadianCape VerdeanCarpatho RusynCelticCentral AmericanCentral American IndianCherokeeCheyenneChickasawChileanChippewaChoctawColombianColvilleComancheCosta RicanCreeCreekCroatianCrowCubanCypriotCzechCzechoslovakianDanishDelawareDominicanDutchDutch West IndianEastern EuropeanEcuadorianEgyptianEnglishEstonianEthiopianEuropeanFijianFilipinoFinnishFrenchFrench American IndianFrench CanadianGermanGerman RussianGhanaianGreekGuamanian/ChamorroGuatemalanGuyaneseHaitianHmongHonduranHopiHoumaHungarianIcelanderIndian (Asian)IndonesianInupiatIranianIraqiIrishIroquoisIsraeliItalianJamaicanJapaneseJordanianKenyanKiowaKoreanLaotianLatvianLebaneseLiberianLithuanianLumbeeLuxembourgerMacedonianMalaysianMalteseMarshalleseMenomineeMexicanMexican American IndianMongolianMoroccanNative HawaiianNavajoNepaleseNew ZealanderNicaraguanNigerianNorthern EuropeanNorwegianOkinawanOsageOttawaPaiutePakistaniPalestinianPanamanianParaguayanPennsylvania GermanPeruvianPimaPolishPortuguesePotawatomiPuebloPuerto RicanPuget Sound SalishRomanianRussianSalvadoranSamoanScandinavianScotch-IrishScottishSeminoleSenegaleseSerbianShoshoneSierra LeoneanSiouxSlavicSlovakSloveneSomaliSouth AfricanSouth AmericanSouth American IndianSoviet UnionSpaniardSpanishSpanish AmericanSpanish American IndianSri LankanSubsaharan AfricanSudaneseSwedishSwissSyrianTaiwaneseThaiTlingit-HaidaTohono O'OdhamTonganTrinidadian and TobagonianTsimshianTurkishU.S. Virgin IslanderUgandanUkrainianUruguayanUteVenezuelanVietnameseWelshWest IndianYakamaYaquiYugoslavianYumanYup'ikZimbabwean
Immigration
NonimmigrantsImmigrantsAfghanistanAfricaAlbaniaArgentinaArmeniaAsiaAustraliaAustriaBahamasBangladeshBarbadosBelarusBelgiumBelizeBoliviaBosnia and HerzegovinaBrazilBulgariaBurma/MyanmarCabo VerdeCambodiaCameroonCanadaCaribbeanCentral AmericaChileChinaColombiaCongoCosta RicaCroatiaCubaCzechoslovakiaDenmarkDominicaDominican RepublicEastern AfricaEastern AsiaEastern EuropeEcuadorEgyptEl SalvadorEnglandEritreaEthiopiaEuropeFijiFranceGermanyGhanaGreeceGrenadaGuatemalaGuyanaHaitiHondurasHong KongHungaryIndiaIndonesiaIranIraqIrelandIsraelItalyJamaicaJapanJordanKazakhstanKenyaKoreaKuwaitLaosLatin AmericaLatviaLebanonLiberiaLithuaniaMalaysiaMexicoMicronesiaMiddle AfricaMoldovaMoroccoNepalNetherlandsNicaraguaNigeriaNorth AmericaNorth MacedoniaNorthern AfricaNorthern EuropeNorwayOceaniaPakistanPanamaPeruPhilippinesPolandPortugalRomaniaRussiaSaudi ArabiaScotlandSenegalSerbiaSierra LeoneSingaporeSomaliaSouth AfricaSouth AmericaSouth Central AsiaSouth Eastern AsiaSouthern EuropeSpainSri LankaSt. Vincent and the GrenadinesSudanSwedenSwitzerlandSyriaTaiwanThailandTrinidad and TobagoTurkeyUgandaUkraineUruguayUzbekistanVenezuelaVietnamWest IndiesWestern AfricaWestern AsiaWestern EuropeYemenZaireZimbabweAzores
Chinese
Race
Ancestry
AfghanAfricanAlaska NativeAlaskan AthabascanAlbanianAleutAlsatianAmericanApacheArabArapahoArgentineanArmenianAssyrian/Chaldean/SyriacAustralianAustrianBahamianBangladeshiBarbadianBasqueBelgianBelizeanBermudanBhutaneseBlackfeetBolivianBrazilianBritishBritish West IndianBulgarianBurmeseCajunCambodianCanadianCape VerdeanCarpatho RusynCelticCentral AmericanCentral American IndianCherokeeCheyenneChickasawChileanChineseChippewaChoctawColombianColvilleComancheCosta RicanCreeCreekCroatianCrowCubanCypriotCzechCzechoslovakianDanishDelawareDominicanDutchDutch West IndianEastern EuropeanEcuadorianEgyptianEnglishEstonianEthiopianEuropeanFijianFilipinoFinnishFrenchFrench American IndianFrench CanadianGermanGerman RussianGhanaianGreekGuamanian/ChamorroGuatemalanGuyaneseHaitianHmongHonduranHopiHoumaHungarianIcelanderIndian (Asian)IndonesianInupiatIranianIraqiIrishIroquoisIsraeliItalianJamaicanJapaneseJordanianKenyanKiowaKoreanLaotianLatvianLebaneseLiberianLithuanianLumbeeLuxembourgerMacedonianMalaysianMalteseMarshalleseMenomineeMexicanMexican American IndianMongolianMoroccanNative HawaiianNavajoNepaleseNew ZealanderNicaraguanNigerianNorthern EuropeanNorwegianOkinawanOsageOttawaPaiutePakistaniPalestinianPanamanianParaguayanPennsylvania GermanPeruvianPimaPolishPortuguesePotawatomiPuebloPuerto RicanPuget Sound SalishRomanianRussianSalvadoranSamoanScandinavianScotch-IrishScottishSeminoleSenegaleseSerbianShoshoneSierra LeoneanSiouxSlavicSlovakSloveneSomaliSouth AfricanSouth AmericanSouth American IndianSoviet UnionSpaniardSpanishSpanish AmericanSpanish American IndianSri LankanSubsaharan AfricanSudaneseSwedishSwissSyrianTaiwaneseThaiTlingit-HaidaTohono O'OdhamTonganTrinidadian and TobagonianTsimshianTurkishU.S. Virgin IslanderUgandanUkrainianUruguayanUteVenezuelanVietnameseWelshWest IndianYakamaYaquiYugoslavianYumanYup'ikZimbabwean
Immigration
NonimmigrantsImmigrantsAfghanistanAfricaAlbaniaArgentinaArmeniaAsiaAustraliaAustriaBahamasBangladeshBarbadosBelarusBelgiumBelizeBoliviaBosnia and HerzegovinaBrazilBulgariaBurma/MyanmarCabo VerdeCambodiaCameroonCanadaCaribbeanCentral AmericaChileChinaColombiaCongoCosta RicaCroatiaCubaCzechoslovakiaDenmarkDominicaDominican RepublicEastern AfricaEastern AsiaEastern EuropeEcuadorEgyptEl SalvadorEnglandEritreaEthiopiaEuropeFijiFranceGermanyGhanaGreeceGrenadaGuatemalaGuyanaHaitiHondurasHong KongHungaryIndiaIndonesiaIranIraqIrelandIsraelItalyJamaicaJapanJordanKazakhstanKenyaKuwaitLaosLatin AmericaLatviaLebanonLiberiaLithuaniaMalaysiaMexicoMicronesiaMiddle AfricaMoldovaMoroccoNepalNetherlandsNicaraguaNigeriaNorth AmericaNorth MacedoniaNorthern AfricaNorthern EuropeNorwayOceaniaPakistanPanamaPeruPhilippinesPolandPortugalRomaniaRussiaSaudi ArabiaScotlandSenegalSerbiaSierra LeoneSingaporeSomaliaSouth AfricaSouth AmericaSouth Central AsiaSouth Eastern AsiaSouthern EuropeSpainSri LankaSt. Vincent and the GrenadinesSudanSwedenSwitzerlandSyriaTaiwanThailandTrinidad and TobagoTurkeyUgandaUkraineUruguayUzbekistanVenezuelaVietnamWest IndiesWestern AfricaWestern AsiaWestern EuropeYemenZaireZimbabweAzores
Unemployment Among Ages 45 to 54 years
Income
Poverty
Unemployment
Labor Participation
Family Structure
Vehicle Availability
Education Level
Disability

Unemployment Among Ages 45 to 54 years Comparison

Immigrants from Korea

Chinese

Exceptional
Exceptional
4.3%
UNEMPLOYMENT AMONG AGES 45 TO 54 YEARS
99.2/ 100
METRIC RATING
60th/ 347
METRIC RANK
4.0%
UNEMPLOYMENT AMONG AGES 45 TO 54 YEARS
100.0/ 100
METRIC RATING
8th/ 347
METRIC RANK

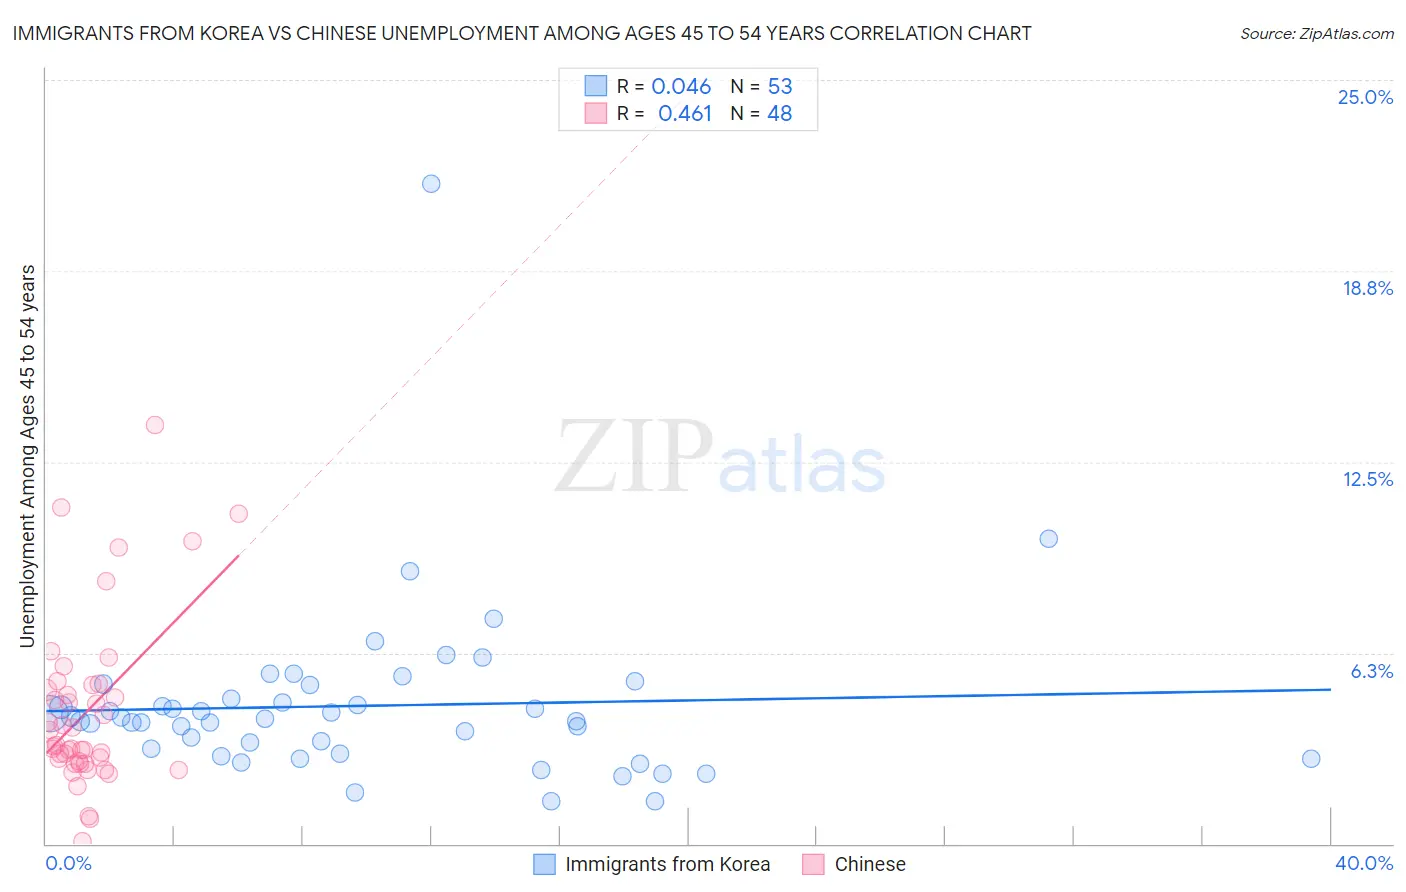
Immigrants from Korea vs Chinese Unemployment Among Ages 45 to 54 years Correlation Chart

The statistical analysis conducted on geographies consisting of 404,336,384 people shows no correlation between the proportion of Immigrants from Korea and unemployment rate among population between the ages 45 and 54 in the United States with a correlation coefficient (R) of 0.046 and weighted average of 4.3%. Similarly, the statistical analysis conducted on geographies consisting of 64,346,004 people shows a moderate positive correlation between the proportion of Chinese and unemployment rate among population between the ages 45 and 54 in the United States with a correlation coefficient (R) of 0.461 and weighted average of 4.0%, a difference of 7.7%.
Immigrants from Korea vs Chinese Unemployment Among Ages 45 to 54 years

Unemployment Among Ages 45 to 54 years Correlation Summary

MeasurementImmigrants from KoreaChinese
Minimum1.4%0.10%
Maximum21.6%13.7%
Range20.2%13.6%
Mean4.5%4.3%
Median4.1%3.2%
Interquartile 25% (IQ1)3.0%2.7%
Interquartile 75% (IQ3)5.0%5.1%
Interquartile Range (IQR)1.9%2.4%
Standard Deviation (Sample)2.9%2.8%
Standard Deviation (Population)2.9%2.8%

Similar Demographics by Unemployment Among Ages 45 to 54 years

Demographics Similar to Immigrants from Korea by Unemployment Among Ages 45 to 54 years

In terms of unemployment among ages 45 to 54 years, the demographic groups most similar to Immigrants from Korea are Immigrants from Pakistan (4.3%, a difference of 0.0%), Okinawan (4.3%, a difference of 0.030%), Greek (4.3%, a difference of 0.11%), Lithuanian (4.3%, a difference of 0.14%), and Immigrants from Sri Lanka (4.3%, a difference of 0.16%).
DemographicsRating | RankUnemployment Among Ages 45 to 54 years
Irish
99.5
/100
|
#53
Exceptional
4.2%
Chickasaw
99.5
/100
|
#54
Exceptional
4.2%
Latvians
99.4
/100
|
#55
Exceptional
4.2%
Immigrants | Jordan
99.3
/100
|
#56
Exceptional
4.3%
Immigrants | Sri Lanka
99.3
/100
|
#57
Exceptional
4.3%
Greeks
99.3
/100
|
#58
Exceptional
4.3%
Okinawans
99.2
/100
|
#59
Exceptional
4.3%
Immigrants | Korea
99.2
/100
|
#60
Exceptional
4.3%
Immigrants | Pakistan
99.2
/100
|
#61
Exceptional
4.3%
Lithuanians
99.1
/100
|
#62
Exceptional
4.3%
Pennsylvania Germans
99.1
/100
|
#63
Exceptional
4.3%
Austrians
99.0
/100
|
#64
Exceptional
4.3%
Immigrants | Sudan
99.0
/100
|
#65
Exceptional
4.3%
Turks
98.9
/100
|
#66
Exceptional
4.3%
Immigrants | Nepal
98.9
/100
|
#67
Exceptional
4.3%

Demographics Similar to Chinese by Unemployment Among Ages 45 to 54 years

In terms of unemployment among ages 45 to 54 years, the demographic groups most similar to Chinese are Czech (4.0%, a difference of 0.16%), Immigrants from Venezuela (3.9%, a difference of 0.36%), Venezuelan (4.0%, a difference of 0.78%), Scandinavian (4.0%, a difference of 0.93%), and Swedish (4.0%, a difference of 0.94%).
DemographicsRating | RankUnemployment Among Ages 45 to 54 years
Hmong
100.0
/100
|
#1
Exceptional
3.7%
Fijians
100.0
/100
|
#2
Exceptional
3.8%
Norwegians
100.0
/100
|
#3
Exceptional
3.9%
Immigrants | India
100.0
/100
|
#4
Exceptional
3.9%
Danes
100.0
/100
|
#5
Exceptional
3.9%
Immigrants | Cuba
100.0
/100
|
#6
Exceptional
3.9%
Immigrants | Venezuela
100.0
/100
|
#7
Exceptional
3.9%
Chinese
100.0
/100
|
#8
Exceptional
4.0%
Czechs
100.0
/100
|
#9
Exceptional
4.0%
Venezuelans
100.0
/100
|
#10
Exceptional
4.0%
Scandinavians
100.0
/100
|
#11
Exceptional
4.0%
Swedes
100.0
/100
|
#12
Exceptional
4.0%
Cubans
100.0
/100
|
#13
Exceptional
4.0%
Immigrants | Bosnia and Herzegovina
100.0
/100
|
#14
Exceptional
4.0%
Immigrants | Bolivia
100.0
/100
|
#15
Exceptional
4.0%