Immigrants from Jamaica vs Inupiat Unemployment Among Ages 30 to 34 years

COMPARE

Immigrants from Jamaica
Race
Ancestry
AfghanAfricanAlaska NativeAlaskan AthabascanAlbanianAleutAlsatianAmericanApacheArabArapahoArgentineanArmenianAssyrian/Chaldean/SyriacAustralianAustrianBahamianBangladeshiBarbadianBasqueBelgianBelizeanBermudanBhutaneseBlackfeetBolivianBrazilianBritishBritish West IndianBulgarianBurmeseCajunCambodianCanadianCape VerdeanCarpatho RusynCelticCentral AmericanCentral American IndianCherokeeCheyenneChickasawChileanChineseChippewaChoctawColombianColvilleComancheCosta RicanCreeCreekCroatianCrowCubanCypriotCzechCzechoslovakianDanishDelawareDominicanDutchDutch West IndianEastern EuropeanEcuadorianEgyptianEnglishEstonianEthiopianEuropeanFijianFilipinoFinnishFrenchFrench American IndianFrench CanadianGermanGerman RussianGhanaianGreekGuamanian/ChamorroGuatemalanGuyaneseHaitianHmongHonduranHopiHoumaHungarianIcelanderIndian (Asian)IndonesianIranianIraqiIrishIroquoisIsraeliItalianJamaicanJapaneseJordanianKenyanKiowaKoreanLaotianLatvianLebaneseLiberianLithuanianLumbeeLuxembourgerMacedonianMalaysianMalteseMarshalleseMenomineeMexicanMexican American IndianMongolianMoroccanNative HawaiianNavajoNepaleseNew ZealanderNicaraguanNigerianNorthern EuropeanNorwegianOkinawanOsageOttawaPaiutePakistaniPalestinianPanamanianParaguayanPennsylvania GermanPeruvianPimaPolishPortuguesePotawatomiPuebloPuerto RicanPuget Sound SalishRomanianRussianSalvadoranSamoanScandinavianScotch-IrishScottishSeminoleSenegaleseSerbianShoshoneSierra LeoneanSiouxSlavicSlovakSloveneSomaliSouth AfricanSouth AmericanSouth American IndianSoviet UnionSpaniardSpanishSpanish AmericanSpanish American IndianSri LankanSubsaharan AfricanSudaneseSwedishSwissSyrianTaiwaneseThaiTlingit-HaidaTohono O'OdhamTonganTrinidadian and TobagonianTsimshianTurkishU.S. Virgin IslanderUgandanUkrainianUruguayanUteVenezuelanVietnameseWelshWest IndianYakamaYaquiYugoslavianYumanYup'ikZimbabwean
Immigration
NonimmigrantsImmigrantsAfghanistanAfricaAlbaniaArgentinaArmeniaAsiaAustraliaAustriaBahamasBangladeshBarbadosBelarusBelgiumBelizeBoliviaBosnia and HerzegovinaBrazilBulgariaBurma/MyanmarCabo VerdeCambodiaCameroonCanadaCaribbeanCentral AmericaChileChinaColombiaCongoCosta RicaCroatiaCubaCzechoslovakiaDenmarkDominicaDominican RepublicEastern AfricaEastern AsiaEastern EuropeEcuadorEgyptEl SalvadorEnglandEritreaEthiopiaEuropeFijiFranceGermanyGhanaGreeceGrenadaGuatemalaGuyanaHaitiHondurasHong KongHungaryIndiaIndonesiaIranIraqIrelandIsraelItalyJamaicaJapanJordanKazakhstanKenyaKoreaKuwaitLaosLatin AmericaLatviaLebanonLiberiaLithuaniaMalaysiaMexicoMicronesiaMiddle AfricaMoldovaMoroccoNepalNetherlandsNicaraguaNigeriaNorth AmericaNorth MacedoniaNorthern AfricaNorthern EuropeNorwayOceaniaPakistanPanamaPeruPhilippinesPolandPortugalRomaniaRussiaSaudi ArabiaScotlandSenegalSerbiaSierra LeoneSingaporeSomaliaSouth AfricaSouth AmericaSouth Central AsiaSouth Eastern AsiaSouthern EuropeSpainSri LankaSt. Vincent and the GrenadinesSudanSwedenSwitzerlandSyriaTaiwanThailandTrinidad and TobagoTurkeyUgandaUkraineUruguayUzbekistanVenezuelaVietnamWest IndiesWestern AfricaWestern AsiaWestern EuropeYemenZaireZimbabweAzores
Inupiat
Race
Ancestry
AfghanAfricanAlaska NativeAlaskan AthabascanAlbanianAleutAlsatianAmericanApacheArabArapahoArgentineanArmenianAssyrian/Chaldean/SyriacAustralianAustrianBahamianBangladeshiBarbadianBasqueBelgianBelizeanBermudanBhutaneseBlackfeetBolivianBrazilianBritishBritish West IndianBulgarianBurmeseCajunCambodianCanadianCape VerdeanCarpatho RusynCelticCentral AmericanCentral American IndianCherokeeCheyenneChickasawChileanChineseChippewaChoctawColombianColvilleComancheCosta RicanCreeCreekCroatianCrowCubanCypriotCzechCzechoslovakianDanishDelawareDominicanDutchDutch West IndianEastern EuropeanEcuadorianEgyptianEnglishEstonianEthiopianEuropeanFijianFilipinoFinnishFrenchFrench American IndianFrench CanadianGermanGerman RussianGhanaianGreekGuamanian/ChamorroGuatemalanGuyaneseHaitianHmongHonduranHopiHoumaHungarianIcelanderIndian (Asian)IndonesianInupiatIranianIraqiIrishIroquoisIsraeliItalianJamaicanJapaneseJordanianKenyanKiowaKoreanLaotianLatvianLebaneseLiberianLithuanianLumbeeLuxembourgerMacedonianMalaysianMalteseMarshalleseMenomineeMexicanMexican American IndianMongolianMoroccanNative HawaiianNavajoNepaleseNew ZealanderNicaraguanNigerianNorthern EuropeanNorwegianOkinawanOsageOttawaPaiutePakistaniPalestinianPanamanianParaguayanPennsylvania GermanPeruvianPimaPolishPortuguesePotawatomiPuebloPuerto RicanPuget Sound SalishRomanianRussianSalvadoranSamoanScandinavianScotch-IrishScottishSeminoleSenegaleseSerbianShoshoneSierra LeoneanSiouxSlavicSlovakSloveneSomaliSouth AfricanSouth AmericanSouth American IndianSoviet UnionSpaniardSpanishSpanish AmericanSpanish American IndianSri LankanSubsaharan AfricanSudaneseSwedishSwissSyrianTaiwaneseThaiTlingit-HaidaTohono O'OdhamTonganTrinidadian and TobagonianTsimshianTurkishU.S. Virgin IslanderUgandanUkrainianUruguayanUteVenezuelanVietnameseWelshWest IndianYakamaYaquiYugoslavianYumanYup'ikZimbabwean
Immigration
NonimmigrantsImmigrantsAfghanistanAfricaAlbaniaArgentinaArmeniaAsiaAustraliaAustriaBahamasBangladeshBarbadosBelarusBelgiumBelizeBoliviaBosnia and HerzegovinaBrazilBulgariaBurma/MyanmarCabo VerdeCambodiaCameroonCanadaCaribbeanCentral AmericaChileChinaColombiaCongoCosta RicaCroatiaCubaCzechoslovakiaDenmarkDominicaDominican RepublicEastern AfricaEastern AsiaEastern EuropeEcuadorEgyptEl SalvadorEnglandEritreaEthiopiaEuropeFijiFranceGermanyGhanaGreeceGrenadaGuatemalaGuyanaHaitiHondurasHong KongHungaryIndiaIndonesiaIranIraqIrelandIsraelItalyJapanJordanKazakhstanKenyaKoreaKuwaitLaosLatin AmericaLatviaLebanonLiberiaLithuaniaMalaysiaMexicoMicronesiaMiddle AfricaMoldovaMoroccoNepalNetherlandsNicaraguaNigeriaNorth AmericaNorth MacedoniaNorthern AfricaNorthern EuropeNorwayOceaniaPakistanPanamaPeruPhilippinesPolandPortugalRomaniaRussiaSaudi ArabiaScotlandSenegalSerbiaSierra LeoneSingaporeSomaliaSouth AfricaSouth AmericaSouth Central AsiaSouth Eastern AsiaSouthern EuropeSpainSri LankaSt. Vincent and the GrenadinesSudanSwedenSwitzerlandSyriaTaiwanThailandTrinidad and TobagoTurkeyUgandaUkraineUruguayUzbekistanVenezuelaVietnamWest IndiesWestern AfricaWestern AsiaWestern EuropeYemenZaireZimbabweAzores
Unemployment Among Ages 30 to 34 years
Income
Poverty
Unemployment
Labor Participation
Family Structure
Vehicle Availability
Education Level
Disability

Unemployment Among Ages 30 to 34 years Comparison

Immigrants from Jamaica

Inupiat

Tragic
Tragic
6.5%
UNEMPLOYMENT AMONG AGES 30 TO 34 YEARS
0.0/ 100
METRIC RATING
296th/ 347
METRIC RANK
10.8%
UNEMPLOYMENT AMONG AGES 30 TO 34 YEARS
0.0/ 100
METRIC RATING
343rd/ 347
METRIC RANK

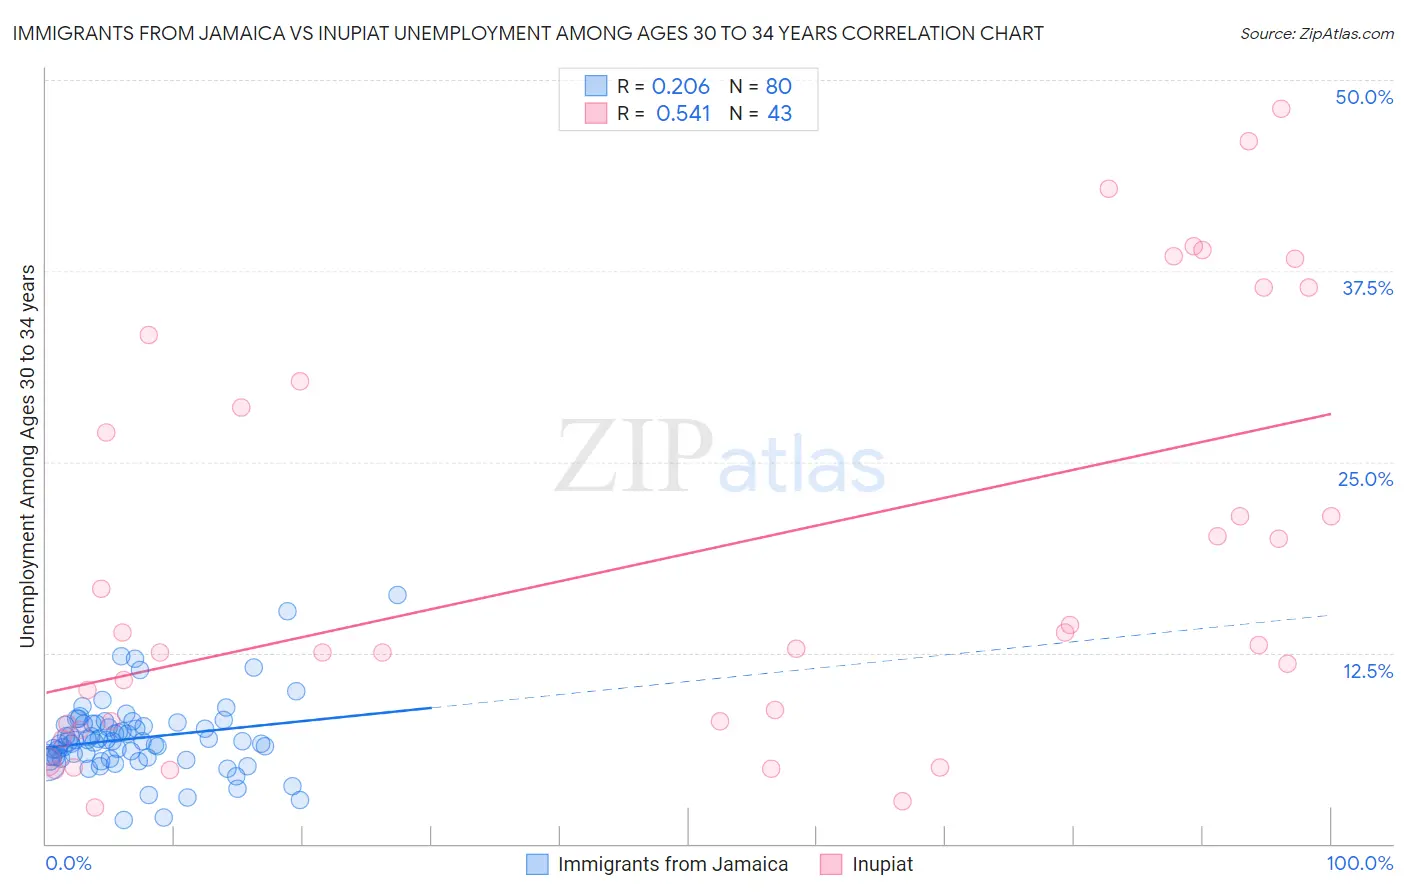
Immigrants from Jamaica vs Inupiat Unemployment Among Ages 30 to 34 years Correlation Chart

The statistical analysis conducted on geographies consisting of 289,463,038 people shows a weak positive correlation between the proportion of Immigrants from Jamaica and unemployment rate among population between the ages 30 and 34 in the United States with a correlation coefficient (R) of 0.206 and weighted average of 6.5%. Similarly, the statistical analysis conducted on geographies consisting of 94,650,433 people shows a substantial positive correlation between the proportion of Inupiat and unemployment rate among population between the ages 30 and 34 in the United States with a correlation coefficient (R) of 0.541 and weighted average of 10.8%, a difference of 65.3%.
Immigrants from Jamaica vs Inupiat Unemployment Among Ages 30 to 34 years

Unemployment Among Ages 30 to 34 years Correlation Summary

MeasurementImmigrants from JamaicaInupiat
Minimum1.5%2.4%
Maximum16.3%48.1%
Range14.8%45.7%
Mean6.9%18.7%
Median6.7%13.0%
Interquartile 25% (IQ1)5.6%7.9%
Interquartile 75% (IQ3)7.8%30.3%
Interquartile Range (IQR)2.2%22.4%
Standard Deviation (Sample)2.4%13.6%
Standard Deviation (Population)2.4%13.4%

Similar Demographics by Unemployment Among Ages 30 to 34 years

Demographics Similar to Immigrants from Jamaica by Unemployment Among Ages 30 to 34 years

In terms of unemployment among ages 30 to 34 years, the demographic groups most similar to Immigrants from Jamaica are Trinidadian and Tobagonian (6.5%, a difference of 0.050%), Creek (6.6%, a difference of 0.10%), Barbadian (6.5%, a difference of 0.29%), Immigrants from Barbados (6.6%, a difference of 0.35%), and Dutch West Indian (6.6%, a difference of 0.45%).
DemographicsRating | RankUnemployment Among Ages 30 to 34 years
Menominee
0.0
/100
|
#289
Tragic
6.4%
Immigrants | Trinidad and Tobago
0.0
/100
|
#290
Tragic
6.5%
Jamaicans
0.0
/100
|
#291
Tragic
6.5%
Vietnamese
0.0
/100
|
#292
Tragic
6.5%
West Indians
0.0
/100
|
#293
Tragic
6.5%
Barbadians
0.0
/100
|
#294
Tragic
6.5%
Trinidadians and Tobagonians
0.0
/100
|
#295
Tragic
6.5%
Immigrants | Jamaica
0.0
/100
|
#296
Tragic
6.5%
Creek
0.0
/100
|
#297
Tragic
6.6%
Immigrants | Barbados
0.0
/100
|
#298
Tragic
6.6%
Dutch West Indians
0.0
/100
|
#299
Tragic
6.6%
Bahamians
0.0
/100
|
#300
Tragic
6.6%
Belizeans
0.0
/100
|
#301
Tragic
6.6%
Delaware
0.0
/100
|
#302
Tragic
6.7%
Cajuns
0.0
/100
|
#303
Tragic
6.7%

Demographics Similar to Inupiat by Unemployment Among Ages 30 to 34 years

In terms of unemployment among ages 30 to 34 years, the demographic groups most similar to Inupiat are Yuman (10.6%, a difference of 2.1%), Navajo (10.6%, a difference of 2.5%), Crow (10.3%, a difference of 4.6%), Tohono O'odham (9.8%, a difference of 10.1%), and Hopi (11.9%, a difference of 10.3%).
DemographicsRating | RankUnemployment Among Ages 30 to 34 years
Pueblo
0.0
/100
|
#333
Tragic
8.3%
Alaska Natives
0.0
/100
|
#334
Tragic
8.5%
Puerto Ricans
0.0
/100
|
#335
Tragic
8.9%
Colville
0.0
/100
|
#336
Tragic
9.0%
Pima
0.0
/100
|
#337
Tragic
9.6%
Yakama
0.0
/100
|
#338
Tragic
9.8%
Tohono O'odham
0.0
/100
|
#339
Tragic
9.8%
Crow
0.0
/100
|
#340
Tragic
10.3%
Navajo
0.0
/100
|
#341
Tragic
10.6%
Yuman
0.0
/100
|
#342
Tragic
10.6%
Inupiat
0.0
/100
|
#343
Tragic
10.8%
Hopi
0.0
/100
|
#344
Tragic
11.9%
Arapaho
0.0
/100
|
#345
Tragic
12.8%
Tsimshian
0.0
/100
|
#346
Tragic
13.8%
Yup'ik
0.0
/100
|
#347
Tragic
18.5%