Immigrants from Jamaica vs Inupiat 8th Grade

COMPARE

Immigrants from Jamaica
Race
Ancestry
AfghanAfricanAlaska NativeAlaskan AthabascanAlbanianAleutAlsatianAmericanApacheArabArapahoArgentineanArmenianAssyrian/Chaldean/SyriacAustralianAustrianBahamianBangladeshiBarbadianBasqueBelgianBelizeanBermudanBhutaneseBlackfeetBolivianBrazilianBritishBritish West IndianBulgarianBurmeseCajunCambodianCanadianCape VerdeanCarpatho RusynCelticCentral AmericanCentral American IndianCherokeeCheyenneChickasawChileanChineseChippewaChoctawColombianColvilleComancheCosta RicanCreeCreekCroatianCrowCubanCypriotCzechCzechoslovakianDanishDelawareDominicanDutchDutch West IndianEastern EuropeanEcuadorianEgyptianEnglishEstonianEthiopianEuropeanFijianFilipinoFinnishFrenchFrench American IndianFrench CanadianGermanGerman RussianGhanaianGreekGuamanian/ChamorroGuatemalanGuyaneseHaitianHmongHonduranHopiHoumaHungarianIcelanderIndian (Asian)IndonesianIranianIraqiIrishIroquoisIsraeliItalianJamaicanJapaneseJordanianKenyanKiowaKoreanLaotianLatvianLebaneseLiberianLithuanianLumbeeLuxembourgerMacedonianMalaysianMalteseMarshalleseMenomineeMexicanMexican American IndianMongolianMoroccanNative HawaiianNavajoNepaleseNew ZealanderNicaraguanNigerianNorthern EuropeanNorwegianOkinawanOsageOttawaPaiutePakistaniPalestinianPanamanianParaguayanPennsylvania GermanPeruvianPimaPolishPortuguesePotawatomiPuebloPuerto RicanPuget Sound SalishRomanianRussianSalvadoranSamoanScandinavianScotch-IrishScottishSeminoleSenegaleseSerbianShoshoneSierra LeoneanSiouxSlavicSlovakSloveneSomaliSouth AfricanSouth AmericanSouth American IndianSoviet UnionSpaniardSpanishSpanish AmericanSpanish American IndianSri LankanSubsaharan AfricanSudaneseSwedishSwissSyrianTaiwaneseThaiTlingit-HaidaTohono O'OdhamTonganTrinidadian and TobagonianTsimshianTurkishU.S. Virgin IslanderUgandanUkrainianUruguayanUteVenezuelanVietnameseWelshWest IndianYakamaYaquiYugoslavianYumanYup'ikZimbabwean
Immigration
NonimmigrantsImmigrantsAfghanistanAfricaAlbaniaArgentinaArmeniaAsiaAustraliaAustriaBahamasBangladeshBarbadosBelarusBelgiumBelizeBoliviaBosnia and HerzegovinaBrazilBulgariaBurma/MyanmarCabo VerdeCambodiaCameroonCanadaCaribbeanCentral AmericaChileChinaColombiaCongoCosta RicaCroatiaCubaCzechoslovakiaDenmarkDominicaDominican RepublicEastern AfricaEastern AsiaEastern EuropeEcuadorEgyptEl SalvadorEnglandEritreaEthiopiaEuropeFijiFranceGermanyGhanaGreeceGrenadaGuatemalaGuyanaHaitiHondurasHong KongHungaryIndiaIndonesiaIranIraqIrelandIsraelItalyJamaicaJapanJordanKazakhstanKenyaKoreaKuwaitLaosLatin AmericaLatviaLebanonLiberiaLithuaniaMalaysiaMexicoMicronesiaMiddle AfricaMoldovaMoroccoNepalNetherlandsNicaraguaNigeriaNorth AmericaNorth MacedoniaNorthern AfricaNorthern EuropeNorwayOceaniaPakistanPanamaPeruPhilippinesPolandPortugalRomaniaRussiaSaudi ArabiaScotlandSenegalSerbiaSierra LeoneSingaporeSomaliaSouth AfricaSouth AmericaSouth Central AsiaSouth Eastern AsiaSouthern EuropeSpainSri LankaSt. Vincent and the GrenadinesSudanSwedenSwitzerlandSyriaTaiwanThailandTrinidad and TobagoTurkeyUgandaUkraineUruguayUzbekistanVenezuelaVietnamWest IndiesWestern AfricaWestern AsiaWestern EuropeYemenZaireZimbabweAzores
Inupiat
Race
Ancestry
AfghanAfricanAlaska NativeAlaskan AthabascanAlbanianAleutAlsatianAmericanApacheArabArapahoArgentineanArmenianAssyrian/Chaldean/SyriacAustralianAustrianBahamianBangladeshiBarbadianBasqueBelgianBelizeanBermudanBhutaneseBlackfeetBolivianBrazilianBritishBritish West IndianBulgarianBurmeseCajunCambodianCanadianCape VerdeanCarpatho RusynCelticCentral AmericanCentral American IndianCherokeeCheyenneChickasawChileanChineseChippewaChoctawColombianColvilleComancheCosta RicanCreeCreekCroatianCrowCubanCypriotCzechCzechoslovakianDanishDelawareDominicanDutchDutch West IndianEastern EuropeanEcuadorianEgyptianEnglishEstonianEthiopianEuropeanFijianFilipinoFinnishFrenchFrench American IndianFrench CanadianGermanGerman RussianGhanaianGreekGuamanian/ChamorroGuatemalanGuyaneseHaitianHmongHonduranHopiHoumaHungarianIcelanderIndian (Asian)IndonesianInupiatIranianIraqiIrishIroquoisIsraeliItalianJamaicanJapaneseJordanianKenyanKiowaKoreanLaotianLatvianLebaneseLiberianLithuanianLumbeeLuxembourgerMacedonianMalaysianMalteseMarshalleseMenomineeMexicanMexican American IndianMongolianMoroccanNative HawaiianNavajoNepaleseNew ZealanderNicaraguanNigerianNorthern EuropeanNorwegianOkinawanOsageOttawaPaiutePakistaniPalestinianPanamanianParaguayanPennsylvania GermanPeruvianPimaPolishPortuguesePotawatomiPuebloPuerto RicanPuget Sound SalishRomanianRussianSalvadoranSamoanScandinavianScotch-IrishScottishSeminoleSenegaleseSerbianShoshoneSierra LeoneanSiouxSlavicSlovakSloveneSomaliSouth AfricanSouth AmericanSouth American IndianSoviet UnionSpaniardSpanishSpanish AmericanSpanish American IndianSri LankanSubsaharan AfricanSudaneseSwedishSwissSyrianTaiwaneseThaiTlingit-HaidaTohono O'OdhamTonganTrinidadian and TobagonianTsimshianTurkishU.S. Virgin IslanderUgandanUkrainianUruguayanUteVenezuelanVietnameseWelshWest IndianYakamaYaquiYugoslavianYumanYup'ikZimbabwean
Immigration
NonimmigrantsImmigrantsAfghanistanAfricaAlbaniaArgentinaArmeniaAsiaAustraliaAustriaBahamasBangladeshBarbadosBelarusBelgiumBelizeBoliviaBosnia and HerzegovinaBrazilBulgariaBurma/MyanmarCabo VerdeCambodiaCameroonCanadaCaribbeanCentral AmericaChileChinaColombiaCongoCosta RicaCroatiaCubaCzechoslovakiaDenmarkDominicaDominican RepublicEastern AfricaEastern AsiaEastern EuropeEcuadorEgyptEl SalvadorEnglandEritreaEthiopiaEuropeFijiFranceGermanyGhanaGreeceGrenadaGuatemalaGuyanaHaitiHondurasHong KongHungaryIndiaIndonesiaIranIraqIrelandIsraelItalyJapanJordanKazakhstanKenyaKoreaKuwaitLaosLatin AmericaLatviaLebanonLiberiaLithuaniaMalaysiaMexicoMicronesiaMiddle AfricaMoldovaMoroccoNepalNetherlandsNicaraguaNigeriaNorth AmericaNorth MacedoniaNorthern AfricaNorthern EuropeNorwayOceaniaPakistanPanamaPeruPhilippinesPolandPortugalRomaniaRussiaSaudi ArabiaScotlandSenegalSerbiaSierra LeoneSingaporeSomaliaSouth AfricaSouth AmericaSouth Central AsiaSouth Eastern AsiaSouthern EuropeSpainSri LankaSt. Vincent and the GrenadinesSudanSwedenSwitzerlandSyriaTaiwanThailandTrinidad and TobagoTurkeyUgandaUkraineUruguayUzbekistanVenezuelaVietnamWest IndiesWestern AfricaWestern AsiaWestern EuropeYemenZaireZimbabweAzores
8th Grade
Income
Poverty
Unemployment
Labor Participation
Family Structure
Vehicle Availability
Education Level
Disability

8th Grade Comparison

Immigrants from Jamaica

Inupiat

Tragic
Exceptional
94.9%
8TH GRADE
0.6/ 100
METRIC RATING
260th/ 347
METRIC RANK
97.0%
8TH GRADE
100.0/ 100
METRIC RATING
40th/ 347
METRIC RANK

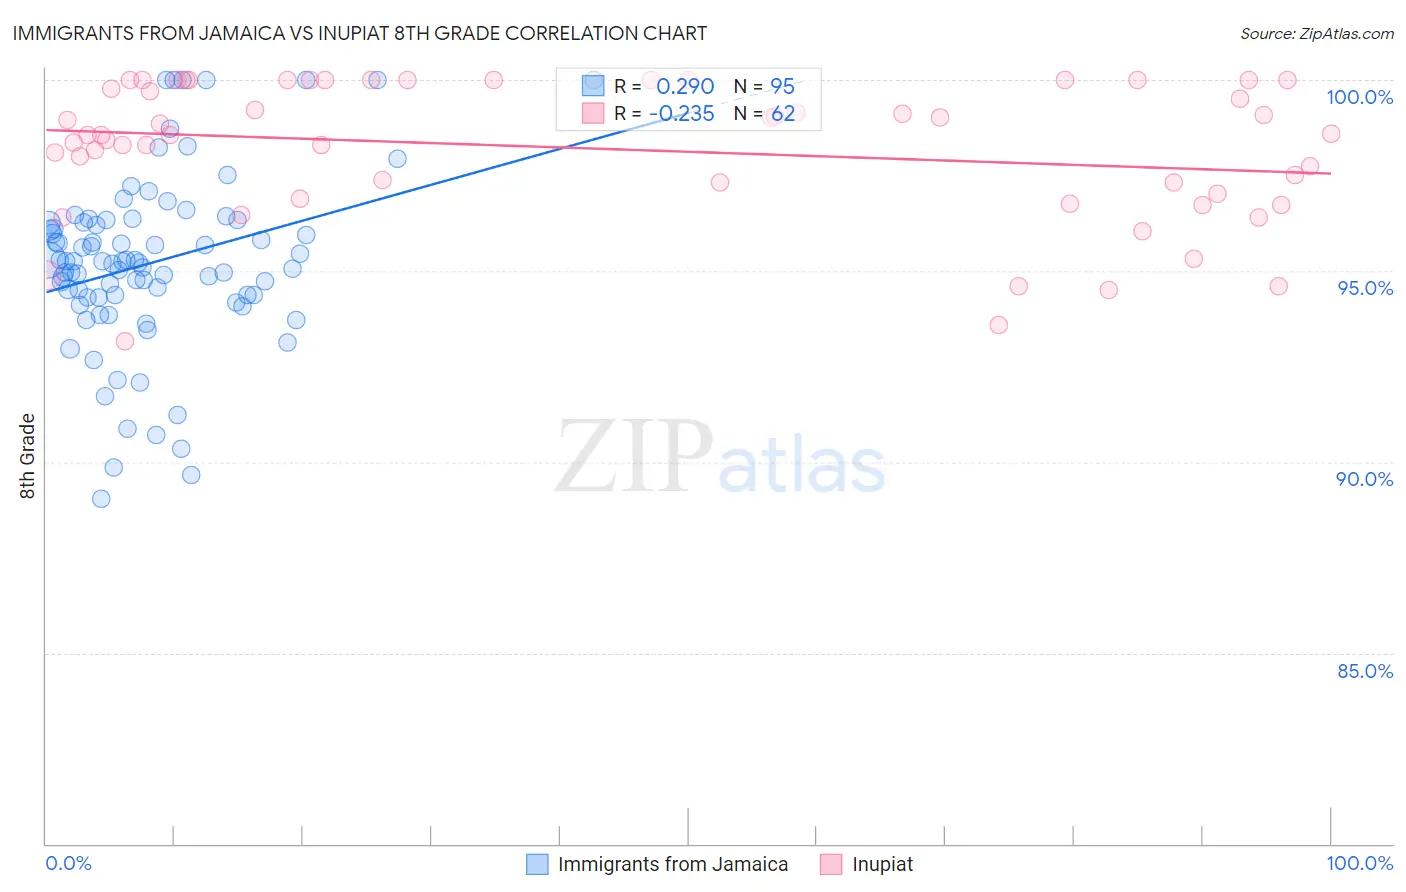
Immigrants from Jamaica vs Inupiat 8th Grade Correlation Chart

The statistical analysis conducted on geographies consisting of 301,829,550 people shows a weak positive correlation between the proportion of Immigrants from Jamaica and percentage of population with at least 8th grade education in the United States with a correlation coefficient (R) of 0.290 and weighted average of 94.9%. Similarly, the statistical analysis conducted on geographies consisting of 96,348,974 people shows a weak negative correlation between the proportion of Inupiat and percentage of population with at least 8th grade education in the United States with a correlation coefficient (R) of -0.235 and weighted average of 97.0%, a difference of 2.1%.
Immigrants from Jamaica vs Inupiat 8th Grade

8th Grade Correlation Summary

MeasurementImmigrants from JamaicaInupiat
Minimum89.0%93.2%
Maximum100.0%100.0%
Range11.0%6.8%
Mean95.2%98.2%
Median95.2%98.6%
Interquartile 25% (IQ1)94.3%97.0%
Interquartile 75% (IQ3)96.3%100.0%
Interquartile Range (IQR)2.0%3.0%
Standard Deviation (Sample)2.3%1.8%
Standard Deviation (Population)2.3%1.8%

Similar Demographics by 8th Grade

Demographics Similar to Immigrants from Jamaica by 8th Grade

In terms of 8th grade, the demographic groups most similar to Immigrants from Jamaica are Ghanaian (94.9%, a difference of 0.0%), Immigrants from Congo (94.9%, a difference of 0.010%), Afghan (94.9%, a difference of 0.020%), Colombian (95.0%, a difference of 0.030%), and Immigrants from Somalia (95.0%, a difference of 0.040%).
DemographicsRating | Rank8th Grade
U.S. Virgin Islanders
0.9
/100
|
#253
Tragic
95.0%
Immigrants | Cameroon
0.8
/100
|
#254
Tragic
95.0%
Immigrants | Somalia
0.7
/100
|
#255
Tragic
95.0%
Colombians
0.7
/100
|
#256
Tragic
95.0%
Afghans
0.6
/100
|
#257
Tragic
94.9%
Immigrants | Congo
0.6
/100
|
#258
Tragic
94.9%
Ghanaians
0.6
/100
|
#259
Tragic
94.9%
Immigrants | Jamaica
0.6
/100
|
#260
Tragic
94.9%
Immigrants | Costa Rica
0.5
/100
|
#261
Tragic
94.9%
Immigrants | Nigeria
0.4
/100
|
#262
Tragic
94.9%
Immigrants | Hong Kong
0.4
/100
|
#263
Tragic
94.9%
South Americans
0.4
/100
|
#264
Tragic
94.9%
Yuman
0.4
/100
|
#265
Tragic
94.9%
West Indians
0.3
/100
|
#266
Tragic
94.8%
Immigrants | Ghana
0.3
/100
|
#267
Tragic
94.8%

Demographics Similar to Inupiat by 8th Grade

In terms of 8th grade, the demographic groups most similar to Inupiat are Eastern European (97.0%, a difference of 0.0%), Hungarian (97.0%, a difference of 0.010%), British (97.0%, a difference of 0.020%), Latvian (97.0%, a difference of 0.030%), and Alaska Native (97.0%, a difference of 0.040%).
DemographicsRating | Rank8th Grade
Swiss
100.0
/100
|
#33
Exceptional
97.0%
Luxembourgers
100.0
/100
|
#34
Exceptional
97.0%
Alaska Natives
100.0
/100
|
#35
Exceptional
97.0%
Belgians
100.0
/100
|
#36
Exceptional
97.0%
Latvians
100.0
/100
|
#37
Exceptional
97.0%
British
100.0
/100
|
#38
Exceptional
97.0%
Hungarians
100.0
/100
|
#39
Exceptional
97.0%
Inupiat
100.0
/100
|
#40
Exceptional
97.0%
Eastern Europeans
100.0
/100
|
#41
Exceptional
97.0%
Chinese
100.0
/100
|
#42
Exceptional
96.9%
Aleuts
99.9
/100
|
#43
Exceptional
96.9%
Maltese
99.9
/100
|
#44
Exceptional
96.9%
Northern Europeans
99.9
/100
|
#45
Exceptional
96.9%
Czechoslovakians
99.9
/100
|
#46
Exceptional
96.9%
Bulgarians
99.9
/100
|
#47
Exceptional
96.9%