Immigrants from Israel vs Dutch West Indian Unemployment Among Seniors over 75 years

COMPARE

Immigrants from Israel
Race
Ancestry
AfghanAfricanAlaska NativeAlaskan AthabascanAlbanianAleutAlsatianAmericanApacheArabArapahoArgentineanArmenianAssyrian/Chaldean/SyriacAustralianAustrianBahamianBangladeshiBarbadianBasqueBelgianBelizeanBermudanBhutaneseBlackfeetBolivianBrazilianBritishBritish West IndianBulgarianBurmeseCajunCambodianCanadianCape VerdeanCarpatho RusynCelticCentral AmericanCentral American IndianCherokeeCheyenneChickasawChileanChineseChippewaChoctawColombianColvilleComancheCosta RicanCreeCreekCroatianCrowCubanCypriotCzechCzechoslovakianDanishDelawareDominicanDutchEastern EuropeanEcuadorianEgyptianEnglishEstonianEthiopianEuropeanFijianFilipinoFinnishFrenchFrench American IndianFrench CanadianGermanGerman RussianGhanaianGreekGuamanian/ChamorroGuatemalanGuyaneseHaitianHmongHonduranHopiHoumaHungarianIcelanderIndian (Asian)IndonesianInupiatIranianIraqiIrishIroquoisIsraeliItalianJamaicanJapaneseJordanianKenyanKiowaKoreanLaotianLatvianLebaneseLiberianLithuanianLumbeeLuxembourgerMacedonianMalaysianMalteseMarshalleseMexicanMexican American IndianMongolianMoroccanNative HawaiianNavajoNepaleseNew ZealanderNicaraguanNigerianNorthern EuropeanNorwegianOkinawanOsageOttawaPaiutePakistaniPalestinianPanamanianParaguayanPennsylvania GermanPeruvianPimaPolishPortuguesePotawatomiPuebloPuerto RicanPuget Sound SalishRomanianRussianSalvadoranSamoanScandinavianScotch-IrishScottishSeminoleSenegaleseSerbianShoshoneSierra LeoneanSiouxSlavicSlovakSloveneSomaliSouth AfricanSouth AmericanSouth American IndianSoviet UnionSpaniardSpanishSpanish AmericanSpanish American IndianSri LankanSubsaharan AfricanSudaneseSwedishSwissSyrianTaiwaneseThaiTlingit-HaidaTohono O'OdhamTonganTrinidadian and TobagonianTsimshianTurkishU.S. Virgin IslanderUgandanUkrainianUruguayanUteVenezuelanVietnameseWelshWest IndianYakamaYaquiYugoslavianYumanYup'ikZimbabwean
Immigration
NonimmigrantsImmigrantsAfghanistanAfricaAlbaniaArgentinaArmeniaAsiaAustraliaAustriaBahamasBangladeshBarbadosBelarusBelgiumBelizeBoliviaBosnia and HerzegovinaBrazilBulgariaBurma/MyanmarCabo VerdeCambodiaCameroonCanadaCaribbeanCentral AmericaChileChinaColombiaCongoCosta RicaCroatiaCubaCzechoslovakiaDenmarkDominicaDominican RepublicEastern AfricaEastern AsiaEastern EuropeEcuadorEgyptEl SalvadorEnglandEritreaEthiopiaEuropeFijiFranceGermanyGhanaGreeceGrenadaGuatemalaGuyanaHaitiHondurasHong KongHungaryIndiaIndonesiaIranIraqIrelandIsraelItalyJamaicaJapanJordanKazakhstanKenyaKoreaKuwaitLaosLatin AmericaLatviaLebanonLiberiaLithuaniaMalaysiaMexicoMicronesiaMiddle AfricaMoldovaMoroccoNepalNetherlandsNicaraguaNigeriaNorth AmericaNorth MacedoniaNorthern AfricaNorthern EuropeNorwayOceaniaPakistanPanamaPeruPhilippinesPolandPortugalRomaniaRussiaSaudi ArabiaScotlandSenegalSerbiaSierra LeoneSingaporeSomaliaSouth AfricaSouth AmericaSouth Central AsiaSouth Eastern AsiaSouthern EuropeSpainSri LankaSt. Vincent and the GrenadinesSudanSwedenSwitzerlandSyriaTaiwanThailandTrinidad and TobagoTurkeyUgandaUkraineUruguayUzbekistanVenezuelaVietnamWest IndiesWestern AfricaWestern AsiaWestern EuropeYemenZaireZimbabweAzores
Dutch West Indian
Race
Ancestry
AfghanAfricanAlaska NativeAlaskan AthabascanAlbanianAleutAlsatianAmericanApacheArabArapahoArgentineanArmenianAssyrian/Chaldean/SyriacAustralianAustrianBahamianBangladeshiBarbadianBasqueBelgianBelizeanBermudanBhutaneseBlackfeetBolivianBrazilianBritishBritish West IndianBulgarianBurmeseCajunCambodianCanadianCape VerdeanCarpatho RusynCelticCentral AmericanCentral American IndianCherokeeCheyenneChickasawChileanChineseChippewaChoctawColombianColvilleComancheCosta RicanCreeCreekCroatianCrowCubanCypriotCzechCzechoslovakianDanishDelawareDominicanDutchDutch West IndianEastern EuropeanEcuadorianEgyptianEnglishEstonianEthiopianEuropeanFijianFilipinoFinnishFrenchFrench American IndianFrench CanadianGermanGerman RussianGhanaianGreekGuamanian/ChamorroGuatemalanGuyaneseHaitianHmongHonduranHopiHoumaHungarianIcelanderIndian (Asian)IndonesianInupiatIranianIraqiIrishIroquoisIsraeliItalianJamaicanJapaneseJordanianKenyanKiowaKoreanLaotianLatvianLebaneseLiberianLithuanianLumbeeLuxembourgerMacedonianMalaysianMalteseMarshalleseMexicanMexican American IndianMongolianMoroccanNative HawaiianNavajoNepaleseNew ZealanderNicaraguanNigerianNorthern EuropeanNorwegianOkinawanOsageOttawaPaiutePakistaniPalestinianPanamanianParaguayanPennsylvania GermanPeruvianPimaPolishPortuguesePotawatomiPuebloPuerto RicanPuget Sound SalishRomanianRussianSalvadoranSamoanScandinavianScotch-IrishScottishSeminoleSenegaleseSerbianShoshoneSierra LeoneanSiouxSlavicSlovakSloveneSomaliSouth AfricanSouth AmericanSouth American IndianSoviet UnionSpaniardSpanishSpanish AmericanSpanish American IndianSri LankanSubsaharan AfricanSudaneseSwedishSwissSyrianTaiwaneseThaiTlingit-HaidaTohono O'OdhamTonganTrinidadian and TobagonianTsimshianTurkishU.S. Virgin IslanderUgandanUkrainianUruguayanUteVenezuelanVietnameseWelshWest IndianYakamaYaquiYugoslavianYumanYup'ikZimbabwean
Immigration
NonimmigrantsImmigrantsAfghanistanAfricaAlbaniaArgentinaArmeniaAsiaAustraliaAustriaBahamasBangladeshBarbadosBelarusBelgiumBelizeBoliviaBosnia and HerzegovinaBrazilBulgariaBurma/MyanmarCabo VerdeCambodiaCameroonCanadaCaribbeanCentral AmericaChileChinaColombiaCongoCosta RicaCroatiaCubaCzechoslovakiaDenmarkDominicaDominican RepublicEastern AfricaEastern AsiaEastern EuropeEcuadorEgyptEl SalvadorEnglandEritreaEthiopiaEuropeFijiFranceGermanyGhanaGreeceGrenadaGuatemalaGuyanaHaitiHondurasHong KongHungaryIndiaIndonesiaIranIraqIrelandItalyJamaicaJapanJordanKazakhstanKenyaKoreaKuwaitLaosLatin AmericaLatviaLebanonLiberiaLithuaniaMalaysiaMexicoMicronesiaMiddle AfricaMoldovaMoroccoNepalNetherlandsNicaraguaNigeriaNorth AmericaNorth MacedoniaNorthern AfricaNorthern EuropeNorwayOceaniaPakistanPanamaPeruPhilippinesPolandPortugalRomaniaRussiaSaudi ArabiaScotlandSenegalSerbiaSierra LeoneSingaporeSomaliaSouth AfricaSouth AmericaSouth Central AsiaSouth Eastern AsiaSouthern EuropeSpainSri LankaSt. Vincent and the GrenadinesSudanSwedenSwitzerlandSyriaTaiwanThailandTrinidad and TobagoTurkeyUgandaUkraineUruguayUzbekistanVenezuelaVietnamWest IndiesWestern AfricaWestern AsiaWestern EuropeYemenZaireZimbabweAzores
Unemployment Among Seniors over 75 years
Income
Poverty
Unemployment
Labor Participation
Family Structure
Vehicle Availability
Education Level
Disability

Unemployment Among Seniors over 75 years Comparison

Immigrants from Israel

Dutch West Indians

Exceptional
Tragic
7.6%
UNEMPLOYMENT AMONG SENIORS OVER 75 YEARS
100.0/ 100
METRIC RATING
28th/ 347
METRIC RANK
10.2%
UNEMPLOYMENT AMONG SENIORS OVER 75 YEARS
0.0/ 100
METRIC RATING
314th/ 347
METRIC RANK

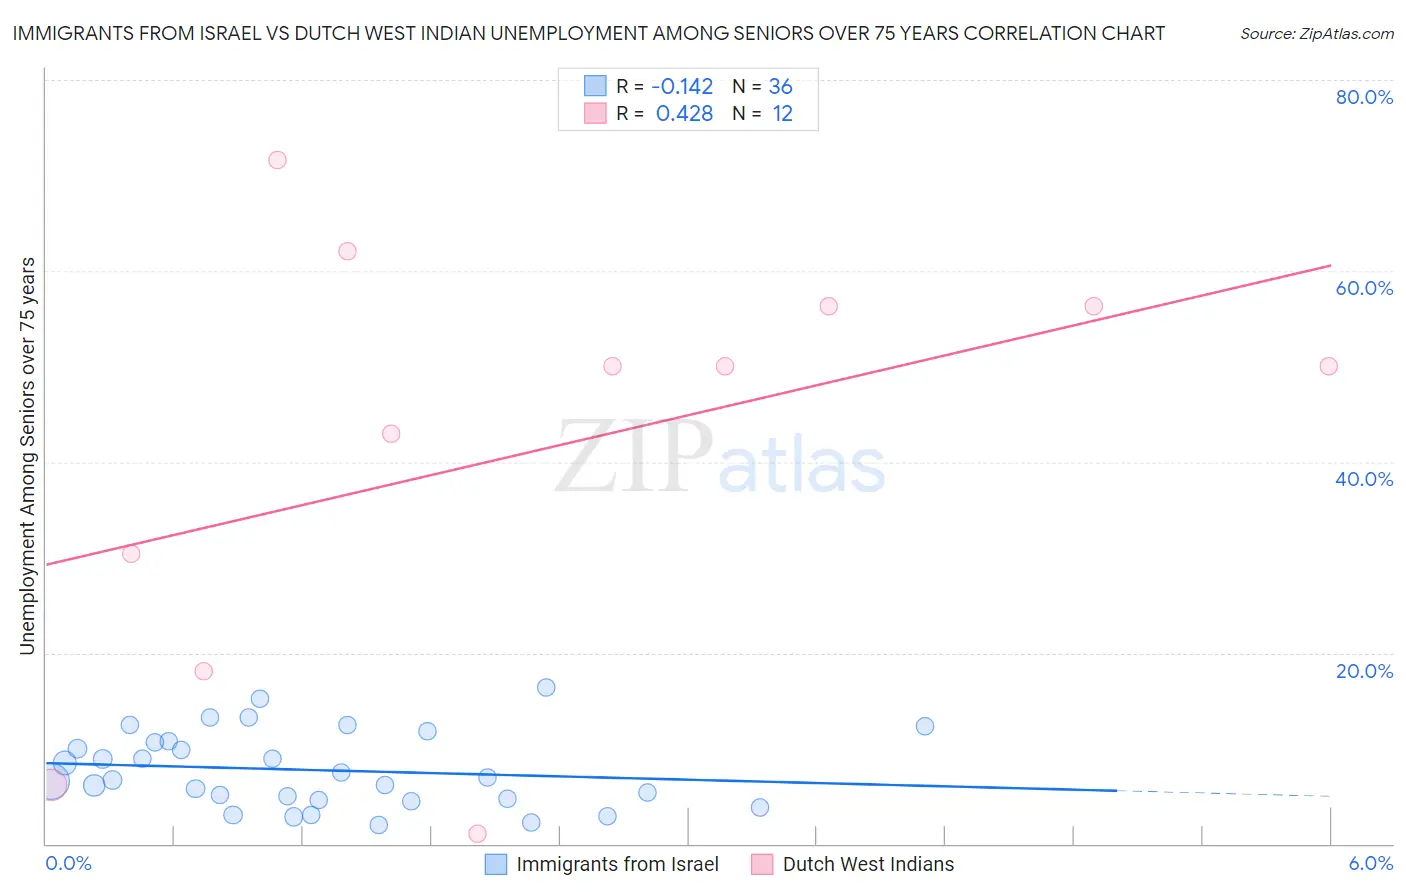
Immigrants from Israel vs Dutch West Indian Unemployment Among Seniors over 75 years Correlation Chart

The statistical analysis conducted on geographies consisting of 139,484,072 people shows a poor negative correlation between the proportion of Immigrants from Israel and unemployment rate among seniors over the age of 75 in the United States with a correlation coefficient (R) of -0.142 and weighted average of 7.6%. Similarly, the statistical analysis conducted on geographies consisting of 61,742,856 people shows a moderate positive correlation between the proportion of Dutch West Indians and unemployment rate among seniors over the age of 75 in the United States with a correlation coefficient (R) of 0.428 and weighted average of 10.2%, a difference of 34.2%.
Immigrants from Israel vs Dutch West Indian Unemployment Among Seniors over 75 years

Unemployment Among Seniors over 75 years Correlation Summary

MeasurementImmigrants from IsraelDutch West Indian
Minimum1.9%1.1%
Maximum16.3%71.6%
Range14.4%70.5%
Mean7.7%41.2%
Median6.8%50.0%
Interquartile 25% (IQ1)4.6%24.2%
Interquartile 75% (IQ3)10.7%56.3%
Interquartile Range (IQR)6.0%32.1%
Standard Deviation (Sample)3.9%22.4%
Standard Deviation (Population)3.9%21.5%

Similar Demographics by Unemployment Among Seniors over 75 years

Demographics Similar to Immigrants from Israel by Unemployment Among Seniors over 75 years

In terms of unemployment among seniors over 75 years, the demographic groups most similar to Immigrants from Israel are Immigrants from Iran (7.6%, a difference of 0.040%), Immigrants from Barbados (7.6%, a difference of 0.11%), Immigrants from Sweden (7.6%, a difference of 0.15%), Guyanese (7.6%, a difference of 0.53%), and South African (7.5%, a difference of 0.55%).
DemographicsRating | RankUnemployment Among Seniors over 75 years
Chickasaw
100.0
/100
|
#21
Exceptional
7.3%
Cypriots
100.0
/100
|
#22
Exceptional
7.4%
Israelis
100.0
/100
|
#23
Exceptional
7.4%
Immigrants | Cuba
100.0
/100
|
#24
Exceptional
7.4%
Immigrants | Uruguay
100.0
/100
|
#25
Exceptional
7.5%
South Africans
100.0
/100
|
#26
Exceptional
7.5%
Immigrants | Barbados
100.0
/100
|
#27
Exceptional
7.6%
Immigrants | Israel
100.0
/100
|
#28
Exceptional
7.6%
Immigrants | Iran
100.0
/100
|
#29
Exceptional
7.6%
Immigrants | Sweden
100.0
/100
|
#30
Exceptional
7.6%
Guyanese
100.0
/100
|
#31
Exceptional
7.6%
Immigrants | Hong Kong
100.0
/100
|
#32
Exceptional
7.6%
Cambodians
100.0
/100
|
#33
Exceptional
7.6%
Immigrants | Eritrea
100.0
/100
|
#34
Exceptional
7.7%
Immigrants | Norway
100.0
/100
|
#35
Exceptional
7.7%

Demographics Similar to Dutch West Indians by Unemployment Among Seniors over 75 years

In terms of unemployment among seniors over 75 years, the demographic groups most similar to Dutch West Indians are Pennsylvania German (10.2%, a difference of 0.12%), Native/Alaskan (10.2%, a difference of 0.36%), Nepalese (10.1%, a difference of 0.45%), Chippewa (10.1%, a difference of 0.57%), and Scottish (10.1%, a difference of 0.58%).
DemographicsRating | RankUnemployment Among Seniors over 75 years
Immigrants | Fiji
0.0
/100
|
#307
Tragic
10.0%
Whites/Caucasians
0.0
/100
|
#308
Tragic
10.1%
English
0.0
/100
|
#309
Tragic
10.1%
Hungarians
0.0
/100
|
#310
Tragic
10.1%
Scottish
0.0
/100
|
#311
Tragic
10.1%
Chippewa
0.0
/100
|
#312
Tragic
10.1%
Nepalese
0.0
/100
|
#313
Tragic
10.1%
Dutch West Indians
0.0
/100
|
#314
Tragic
10.2%
Pennsylvania Germans
0.0
/100
|
#315
Tragic
10.2%
Natives/Alaskans
0.0
/100
|
#316
Tragic
10.2%
Irish
0.0
/100
|
#317
Tragic
10.2%
Liberians
0.0
/100
|
#318
Tragic
10.2%
Germans
0.0
/100
|
#319
Tragic
10.3%
French
0.0
/100
|
#320
Tragic
10.3%
Aleuts
0.0
/100
|
#321
Tragic
10.3%