Immigrants from Israel vs Argentinean Unemployment Among Seniors over 75 years

COMPARE

Immigrants from Israel
Race
Ancestry
AfghanAfricanAlaska NativeAlaskan AthabascanAlbanianAleutAlsatianAmericanApacheArabArapahoArmenianAssyrian/Chaldean/SyriacAustralianAustrianBahamianBangladeshiBarbadianBasqueBelgianBelizeanBermudanBhutaneseBlackfeetBolivianBrazilianBritishBritish West IndianBulgarianBurmeseCajunCambodianCanadianCape VerdeanCarpatho RusynCelticCentral AmericanCentral American IndianCherokeeCheyenneChickasawChileanChineseChippewaChoctawColombianColvilleComancheCosta RicanCreeCreekCroatianCrowCubanCypriotCzechCzechoslovakianDanishDelawareDominicanDutchDutch West IndianEastern EuropeanEcuadorianEgyptianEnglishEstonianEthiopianEuropeanFijianFilipinoFinnishFrenchFrench American IndianFrench CanadianGermanGerman RussianGhanaianGreekGuamanian/ChamorroGuatemalanGuyaneseHaitianHmongHonduranHopiHoumaHungarianIcelanderIndian (Asian)IndonesianInupiatIranianIraqiIrishIroquoisIsraeliItalianJamaicanJapaneseJordanianKenyanKiowaKoreanLaotianLatvianLebaneseLiberianLithuanianLumbeeLuxembourgerMacedonianMalaysianMalteseMarshalleseMexicanMexican American IndianMongolianMoroccanNative HawaiianNavajoNepaleseNew ZealanderNicaraguanNigerianNorthern EuropeanNorwegianOkinawanOsageOttawaPaiutePakistaniPalestinianPanamanianParaguayanPennsylvania GermanPeruvianPimaPolishPortuguesePotawatomiPuebloPuerto RicanPuget Sound SalishRomanianRussianSalvadoranSamoanScandinavianScotch-IrishScottishSeminoleSenegaleseSerbianShoshoneSierra LeoneanSiouxSlavicSlovakSloveneSomaliSouth AfricanSouth AmericanSouth American IndianSoviet UnionSpaniardSpanishSpanish AmericanSpanish American IndianSri LankanSubsaharan AfricanSudaneseSwedishSwissSyrianTaiwaneseThaiTlingit-HaidaTohono O'OdhamTonganTrinidadian and TobagonianTsimshianTurkishU.S. Virgin IslanderUgandanUkrainianUruguayanUteVenezuelanVietnameseWelshWest IndianYakamaYaquiYugoslavianYumanYup'ikZimbabwean
Immigration
NonimmigrantsImmigrantsAfghanistanAfricaAlbaniaArgentinaArmeniaAsiaAustraliaAustriaBahamasBangladeshBarbadosBelarusBelgiumBelizeBoliviaBosnia and HerzegovinaBrazilBulgariaBurma/MyanmarCabo VerdeCambodiaCameroonCanadaCaribbeanCentral AmericaChileChinaColombiaCongoCosta RicaCroatiaCubaCzechoslovakiaDenmarkDominicaDominican RepublicEastern AfricaEastern AsiaEastern EuropeEcuadorEgyptEl SalvadorEnglandEritreaEthiopiaEuropeFijiFranceGermanyGhanaGreeceGrenadaGuatemalaGuyanaHaitiHondurasHong KongHungaryIndiaIndonesiaIranIraqIrelandIsraelItalyJamaicaJapanJordanKazakhstanKenyaKoreaKuwaitLaosLatin AmericaLatviaLebanonLiberiaLithuaniaMalaysiaMexicoMicronesiaMiddle AfricaMoldovaMoroccoNepalNetherlandsNicaraguaNigeriaNorth AmericaNorth MacedoniaNorthern AfricaNorthern EuropeNorwayOceaniaPakistanPanamaPeruPhilippinesPolandPortugalRomaniaRussiaSaudi ArabiaScotlandSenegalSerbiaSierra LeoneSingaporeSomaliaSouth AfricaSouth AmericaSouth Central AsiaSouth Eastern AsiaSouthern EuropeSpainSri LankaSt. Vincent and the GrenadinesSudanSwedenSwitzerlandSyriaTaiwanThailandTrinidad and TobagoTurkeyUgandaUkraineUruguayUzbekistanVenezuelaVietnamWest IndiesWestern AfricaWestern AsiaWestern EuropeYemenZaireZimbabweAzores
Argentinean
Race
Ancestry
AfghanAfricanAlaska NativeAlaskan AthabascanAlbanianAleutAlsatianAmericanApacheArabArapahoArgentineanArmenianAssyrian/Chaldean/SyriacAustralianAustrianBahamianBangladeshiBarbadianBasqueBelgianBelizeanBermudanBhutaneseBlackfeetBolivianBrazilianBritishBritish West IndianBulgarianBurmeseCajunCambodianCanadianCape VerdeanCarpatho RusynCelticCentral AmericanCentral American IndianCherokeeCheyenneChickasawChileanChineseChippewaChoctawColombianColvilleComancheCosta RicanCreeCreekCroatianCrowCubanCypriotCzechCzechoslovakianDanishDelawareDominicanDutchDutch West IndianEastern EuropeanEcuadorianEgyptianEnglishEstonianEthiopianEuropeanFijianFilipinoFinnishFrenchFrench American IndianFrench CanadianGermanGerman RussianGhanaianGreekGuamanian/ChamorroGuatemalanGuyaneseHaitianHmongHonduranHopiHoumaHungarianIcelanderIndian (Asian)IndonesianInupiatIranianIraqiIrishIroquoisIsraeliItalianJamaicanJapaneseJordanianKenyanKiowaKoreanLaotianLatvianLebaneseLiberianLithuanianLumbeeLuxembourgerMacedonianMalaysianMalteseMarshalleseMexicanMexican American IndianMongolianMoroccanNative HawaiianNavajoNepaleseNew ZealanderNicaraguanNigerianNorthern EuropeanNorwegianOkinawanOsageOttawaPaiutePakistaniPalestinianPanamanianParaguayanPennsylvania GermanPeruvianPimaPolishPortuguesePotawatomiPuebloPuerto RicanPuget Sound SalishRomanianRussianSalvadoranSamoanScandinavianScotch-IrishScottishSeminoleSenegaleseSerbianShoshoneSierra LeoneanSiouxSlavicSlovakSloveneSomaliSouth AfricanSouth AmericanSouth American IndianSoviet UnionSpaniardSpanishSpanish AmericanSpanish American IndianSri LankanSubsaharan AfricanSudaneseSwedishSwissSyrianTaiwaneseThaiTlingit-HaidaTohono O'OdhamTonganTrinidadian and TobagonianTsimshianTurkishU.S. Virgin IslanderUgandanUkrainianUruguayanUteVenezuelanVietnameseWelshWest IndianYakamaYaquiYugoslavianYumanYup'ikZimbabwean
Immigration
NonimmigrantsImmigrantsAfghanistanAfricaAlbaniaArgentinaArmeniaAsiaAustraliaAustriaBahamasBangladeshBarbadosBelarusBelgiumBelizeBoliviaBosnia and HerzegovinaBrazilBulgariaBurma/MyanmarCabo VerdeCambodiaCameroonCanadaCaribbeanCentral AmericaChileChinaColombiaCongoCosta RicaCroatiaCubaCzechoslovakiaDenmarkDominicaDominican RepublicEastern AfricaEastern AsiaEastern EuropeEcuadorEgyptEl SalvadorEnglandEritreaEthiopiaEuropeFijiFranceGermanyGhanaGreeceGrenadaGuatemalaGuyanaHaitiHondurasHong KongHungaryIndiaIndonesiaIranIraqIrelandItalyJamaicaJapanJordanKazakhstanKenyaKoreaKuwaitLaosLatin AmericaLatviaLebanonLiberiaLithuaniaMalaysiaMexicoMicronesiaMiddle AfricaMoldovaMoroccoNepalNetherlandsNicaraguaNigeriaNorth AmericaNorth MacedoniaNorthern AfricaNorthern EuropeNorwayOceaniaPakistanPanamaPeruPhilippinesPolandPortugalRomaniaRussiaSaudi ArabiaScotlandSenegalSerbiaSierra LeoneSingaporeSomaliaSouth AfricaSouth AmericaSouth Central AsiaSouth Eastern AsiaSouthern EuropeSpainSri LankaSt. Vincent and the GrenadinesSudanSwedenSwitzerlandSyriaTaiwanThailandTrinidad and TobagoTurkeyUgandaUkraineUruguayUzbekistanVenezuelaVietnamWest IndiesWestern AfricaWestern AsiaWestern EuropeYemenZaireZimbabweAzores
Unemployment Among Seniors over 75 years
Income
Poverty
Unemployment
Labor Participation
Family Structure
Vehicle Availability
Education Level
Disability

Unemployment Among Seniors over 75 years Comparison

Immigrants from Israel

Argentineans

Exceptional
Exceptional
7.6%
UNEMPLOYMENT AMONG SENIORS OVER 75 YEARS
100.0/ 100
METRIC RATING
28th/ 347
METRIC RANK
7.9%
UNEMPLOYMENT AMONG SENIORS OVER 75 YEARS
99.9/ 100
METRIC RATING
65th/ 347
METRIC RANK

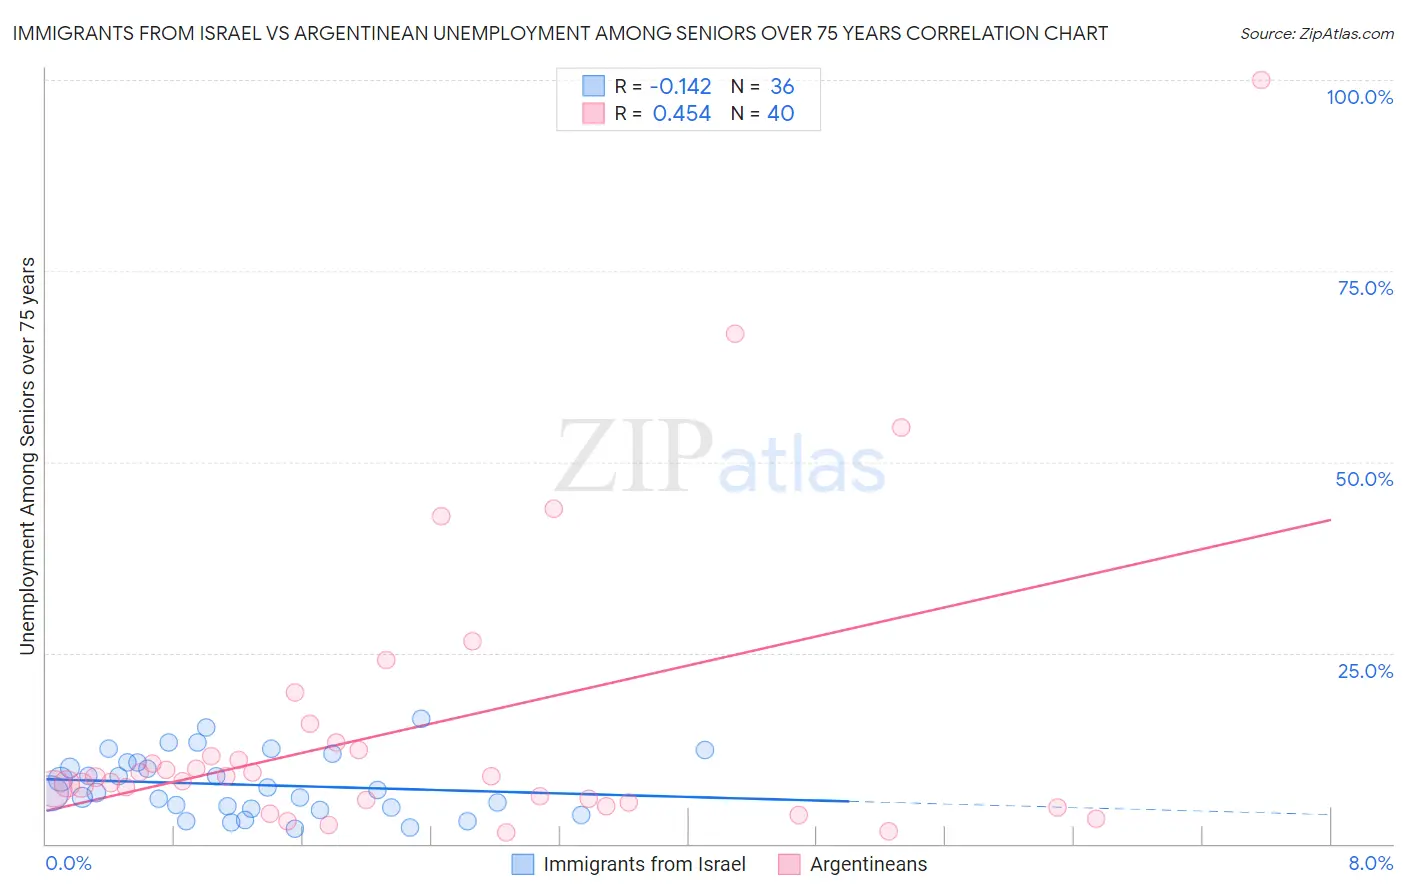
Immigrants from Israel vs Argentinean Unemployment Among Seniors over 75 years Correlation Chart

The statistical analysis conducted on geographies consisting of 139,484,072 people shows a poor negative correlation between the proportion of Immigrants from Israel and unemployment rate among seniors over the age of 75 in the United States with a correlation coefficient (R) of -0.142 and weighted average of 7.6%. Similarly, the statistical analysis conducted on geographies consisting of 172,532,290 people shows a moderate positive correlation between the proportion of Argentineans and unemployment rate among seniors over the age of 75 in the United States with a correlation coefficient (R) of 0.454 and weighted average of 7.9%, a difference of 4.9%.
Immigrants from Israel vs Argentinean Unemployment Among Seniors over 75 years

Unemployment Among Seniors over 75 years Correlation Summary

MeasurementImmigrants from IsraelArgentinean
Minimum1.9%1.5%
Maximum16.3%100.0%
Range14.4%98.5%
Mean7.7%15.4%
Median6.8%8.8%
Interquartile 25% (IQ1)4.6%5.6%
Interquartile 75% (IQ3)10.7%12.8%
Interquartile Range (IQR)6.0%7.2%
Standard Deviation (Sample)3.9%19.9%
Standard Deviation (Population)3.9%19.7%

Similar Demographics by Unemployment Among Seniors over 75 years

Demographics Similar to Immigrants from Israel by Unemployment Among Seniors over 75 years

In terms of unemployment among seniors over 75 years, the demographic groups most similar to Immigrants from Israel are Immigrants from Iran (7.6%, a difference of 0.040%), Immigrants from Barbados (7.6%, a difference of 0.11%), Immigrants from Sweden (7.6%, a difference of 0.15%), Guyanese (7.6%, a difference of 0.53%), and South African (7.5%, a difference of 0.55%).
DemographicsRating | RankUnemployment Among Seniors over 75 years
Chickasaw
100.0
/100
|
#21
Exceptional
7.3%
Cypriots
100.0
/100
|
#22
Exceptional
7.4%
Israelis
100.0
/100
|
#23
Exceptional
7.4%
Immigrants | Cuba
100.0
/100
|
#24
Exceptional
7.4%
Immigrants | Uruguay
100.0
/100
|
#25
Exceptional
7.5%
South Africans
100.0
/100
|
#26
Exceptional
7.5%
Immigrants | Barbados
100.0
/100
|
#27
Exceptional
7.6%
Immigrants | Israel
100.0
/100
|
#28
Exceptional
7.6%
Immigrants | Iran
100.0
/100
|
#29
Exceptional
7.6%
Immigrants | Sweden
100.0
/100
|
#30
Exceptional
7.6%
Guyanese
100.0
/100
|
#31
Exceptional
7.6%
Immigrants | Hong Kong
100.0
/100
|
#32
Exceptional
7.6%
Cambodians
100.0
/100
|
#33
Exceptional
7.6%
Immigrants | Eritrea
100.0
/100
|
#34
Exceptional
7.7%
Immigrants | Norway
100.0
/100
|
#35
Exceptional
7.7%

Demographics Similar to Argentineans by Unemployment Among Seniors over 75 years

In terms of unemployment among seniors over 75 years, the demographic groups most similar to Argentineans are Immigrants from Taiwan (7.9%, a difference of 0.060%), Immigrants from Nicaragua (7.9%, a difference of 0.12%), Immigrants from Albania (7.9%, a difference of 0.19%), Immigrants from Austria (8.0%, a difference of 0.19%), and Uruguayan (7.9%, a difference of 0.22%).
DemographicsRating | RankUnemployment Among Seniors over 75 years
Iranians
99.9
/100
|
#58
Exceptional
7.9%
Indonesians
99.9
/100
|
#59
Exceptional
7.9%
Immigrants | Morocco
99.9
/100
|
#60
Exceptional
7.9%
Uruguayans
99.9
/100
|
#61
Exceptional
7.9%
Immigrants | Albania
99.9
/100
|
#62
Exceptional
7.9%
Immigrants | Nicaragua
99.9
/100
|
#63
Exceptional
7.9%
Immigrants | Taiwan
99.9
/100
|
#64
Exceptional
7.9%
Argentineans
99.9
/100
|
#65
Exceptional
7.9%
Immigrants | Austria
99.9
/100
|
#66
Exceptional
8.0%
Immigrants | Syria
99.9
/100
|
#67
Exceptional
8.0%
Immigrants | South Africa
99.9
/100
|
#68
Exceptional
8.0%
Indians (Asian)
99.9
/100
|
#69
Exceptional
8.0%
Immigrants | Argentina
99.9
/100
|
#70
Exceptional
8.0%
Immigrants | Cambodia
99.9
/100
|
#71
Exceptional
8.0%
Bolivians
99.9
/100
|
#72
Exceptional
8.0%