Immigrants from Greece vs Immigrants from Africa Unemployment Among Ages 55 to 59 years

COMPARE

Immigrants from Greece
Race
Ancestry
AfghanAfricanAlaska NativeAlaskan AthabascanAlbanianAleutAlsatianAmericanApacheArabArapahoArgentineanArmenianAssyrian/Chaldean/SyriacAustralianAustrianBahamianBangladeshiBarbadianBasqueBelgianBelizeanBermudanBhutaneseBlackfeetBolivianBrazilianBritishBritish West IndianBulgarianBurmeseCajunCambodianCanadianCape VerdeanCarpatho RusynCelticCentral AmericanCentral American IndianCherokeeCheyenneChickasawChileanChineseChippewaChoctawColombianColvilleComancheCosta RicanCreeCreekCroatianCrowCubanCypriotCzechCzechoslovakianDanishDelawareDominicanDutchDutch West IndianEastern EuropeanEcuadorianEgyptianEnglishEstonianEthiopianEuropeanFijianFilipinoFinnishFrenchFrench American IndianFrench CanadianGermanGerman RussianGhanaianGreekGuamanian/ChamorroGuatemalanGuyaneseHaitianHmongHonduranHopiHoumaHungarianIcelanderIndian (Asian)IndonesianInupiatIranianIraqiIrishIroquoisIsraeliItalianJamaicanJapaneseJordanianKenyanKiowaKoreanLaotianLatvianLebaneseLiberianLithuanianLumbeeLuxembourgerMacedonianMalaysianMalteseMarshalleseMenomineeMexicanMexican American IndianMongolianMoroccanNative HawaiianNavajoNepaleseNew ZealanderNicaraguanNigerianNorthern EuropeanNorwegianOkinawanOsageOttawaPaiutePakistaniPalestinianPanamanianParaguayanPennsylvania GermanPeruvianPimaPolishPortuguesePotawatomiPuebloPuerto RicanPuget Sound SalishRomanianRussianSalvadoranSamoanScandinavianScotch-IrishScottishSeminoleSenegaleseSerbianShoshoneSierra LeoneanSiouxSlavicSlovakSloveneSomaliSouth AfricanSouth AmericanSouth American IndianSoviet UnionSpaniardSpanishSpanish AmericanSpanish American IndianSri LankanSubsaharan AfricanSudaneseSwedishSwissSyrianTaiwaneseThaiTlingit-HaidaTohono O'OdhamTonganTrinidadian and TobagonianTsimshianTurkishU.S. Virgin IslanderUgandanUkrainianUruguayanUteVenezuelanVietnameseWelshWest IndianYakamaYaquiYugoslavianYumanYup'ikZimbabwean
Immigration
NonimmigrantsImmigrantsAfghanistanAlbaniaArgentinaArmeniaAsiaAustraliaAustriaBahamasBangladeshBarbadosBelarusBelgiumBelizeBoliviaBosnia and HerzegovinaBrazilBulgariaBurma/MyanmarCabo VerdeCambodiaCameroonCanadaCaribbeanCentral AmericaChileChinaColombiaCongoCosta RicaCroatiaCubaCzechoslovakiaDenmarkDominicaDominican RepublicEastern AfricaEastern AsiaEastern EuropeEcuadorEgyptEl SalvadorEnglandEritreaEthiopiaEuropeFijiFranceGermanyGhanaGreeceGrenadaGuatemalaGuyanaHaitiHondurasHong KongHungaryIndiaIndonesiaIranIraqIrelandIsraelItalyJamaicaJapanJordanKazakhstanKenyaKoreaKuwaitLaosLatin AmericaLatviaLebanonLiberiaLithuaniaMalaysiaMexicoMicronesiaMiddle AfricaMoldovaMoroccoNepalNetherlandsNicaraguaNigeriaNorth AmericaNorth MacedoniaNorthern AfricaNorthern EuropeNorwayOceaniaPakistanPanamaPeruPhilippinesPolandPortugalRomaniaRussiaSaudi ArabiaScotlandSenegalSerbiaSierra LeoneSingaporeSomaliaSouth AfricaSouth AmericaSouth Central AsiaSouth Eastern AsiaSouthern EuropeSpainSri LankaSt. Vincent and the GrenadinesSudanSwedenSwitzerlandSyriaTaiwanThailandTrinidad and TobagoTurkeyUgandaUkraineUruguayUzbekistanVenezuelaVietnamWest IndiesWestern AfricaWestern AsiaWestern EuropeYemenZaireZimbabweAzores
Immigrants from Africa
Race
Ancestry
AfghanAfricanAlaska NativeAlaskan AthabascanAlbanianAleutAlsatianAmericanApacheArabArapahoArgentineanArmenianAssyrian/Chaldean/SyriacAustralianAustrianBahamianBangladeshiBarbadianBasqueBelgianBelizeanBermudanBhutaneseBlackfeetBolivianBrazilianBritishBritish West IndianBulgarianBurmeseCajunCambodianCanadianCape VerdeanCarpatho RusynCelticCentral AmericanCentral American IndianCherokeeCheyenneChickasawChileanChineseChippewaChoctawColombianColvilleComancheCosta RicanCreeCreekCroatianCrowCubanCypriotCzechCzechoslovakianDanishDelawareDominicanDutchDutch West IndianEastern EuropeanEcuadorianEgyptianEnglishEstonianEthiopianEuropeanFijianFilipinoFinnishFrenchFrench American IndianFrench CanadianGermanGerman RussianGhanaianGreekGuamanian/ChamorroGuatemalanGuyaneseHaitianHmongHonduranHopiHoumaHungarianIcelanderIndian (Asian)IndonesianInupiatIranianIraqiIrishIroquoisIsraeliItalianJamaicanJapaneseJordanianKenyanKiowaKoreanLaotianLatvianLebaneseLiberianLithuanianLumbeeLuxembourgerMacedonianMalaysianMalteseMarshalleseMenomineeMexicanMexican American IndianMongolianMoroccanNative HawaiianNavajoNepaleseNew ZealanderNicaraguanNigerianNorthern EuropeanNorwegianOkinawanOsageOttawaPaiutePakistaniPalestinianPanamanianParaguayanPennsylvania GermanPeruvianPimaPolishPortuguesePotawatomiPuebloPuerto RicanPuget Sound SalishRomanianRussianSalvadoranSamoanScandinavianScotch-IrishScottishSeminoleSenegaleseSerbianShoshoneSierra LeoneanSiouxSlavicSlovakSloveneSomaliSouth AfricanSouth AmericanSouth American IndianSoviet UnionSpaniardSpanishSpanish AmericanSpanish American IndianSri LankanSubsaharan AfricanSudaneseSwedishSwissSyrianTaiwaneseThaiTlingit-HaidaTohono O'OdhamTonganTrinidadian and TobagonianTsimshianTurkishU.S. Virgin IslanderUgandanUkrainianUruguayanUteVenezuelanVietnameseWelshWest IndianYakamaYaquiYugoslavianYumanYup'ikZimbabwean
Immigration
NonimmigrantsImmigrantsAfghanistanAfricaAlbaniaArgentinaArmeniaAsiaAustraliaAustriaBahamasBangladeshBarbadosBelarusBelgiumBelizeBoliviaBosnia and HerzegovinaBrazilBulgariaBurma/MyanmarCabo VerdeCambodiaCameroonCanadaCaribbeanCentral AmericaChileChinaColombiaCongoCosta RicaCroatiaCubaCzechoslovakiaDenmarkDominicaDominican RepublicEastern AfricaEastern AsiaEastern EuropeEcuadorEgyptEl SalvadorEnglandEritreaEthiopiaEuropeFijiFranceGermanyGhanaGrenadaGuatemalaGuyanaHaitiHondurasHong KongHungaryIndiaIndonesiaIranIraqIrelandIsraelItalyJamaicaJapanJordanKazakhstanKenyaKoreaKuwaitLaosLatin AmericaLatviaLebanonLiberiaLithuaniaMalaysiaMexicoMicronesiaMiddle AfricaMoldovaMoroccoNepalNetherlandsNicaraguaNigeriaNorth AmericaNorth MacedoniaNorthern AfricaNorthern EuropeNorwayOceaniaPakistanPanamaPeruPhilippinesPolandPortugalRomaniaRussiaSaudi ArabiaScotlandSenegalSerbiaSierra LeoneSingaporeSomaliaSouth AfricaSouth AmericaSouth Central AsiaSouth Eastern AsiaSouthern EuropeSpainSri LankaSt. Vincent and the GrenadinesSudanSwedenSwitzerlandSyriaTaiwanThailandTrinidad and TobagoTurkeyUgandaUkraineUruguayUzbekistanVenezuelaVietnamWest IndiesWestern AfricaWestern AsiaWestern EuropeYemenZaireZimbabweAzores
Unemployment Among Ages 55 to 59 years
Income
Poverty
Unemployment
Labor Participation
Family Structure
Vehicle Availability
Education Level
Disability

Unemployment Among Ages 55 to 59 years Comparison

Immigrants from Greece

Immigrants from Africa

Tragic
Good
5.1%
UNEMPLOYMENT AMONG AGES 55 TO 59 YEARS
0.6/ 100
METRIC RATING
246th/ 347
METRIC RANK
4.8%
UNEMPLOYMENT AMONG AGES 55 TO 59 YEARS
64.2/ 100
METRIC RATING
162nd/ 347
METRIC RANK

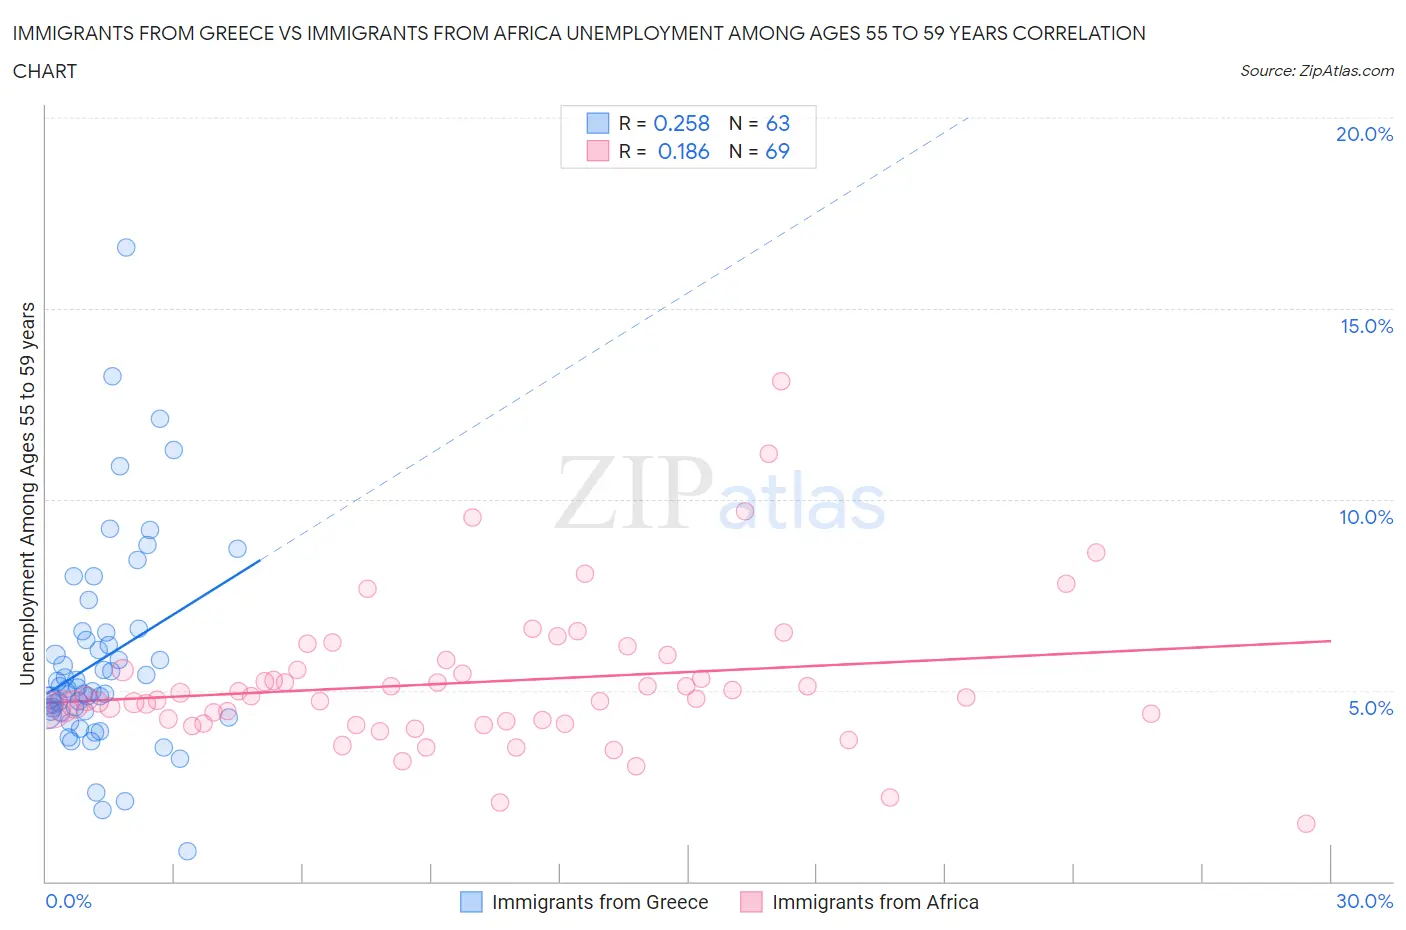
Immigrants from Greece vs Immigrants from Africa Unemployment Among Ages 55 to 59 years Correlation Chart

The statistical analysis conducted on geographies consisting of 208,718,729 people shows a weak positive correlation between the proportion of Immigrants from Greece and unemployment rate among population between the ages 55 and 59 in the United States with a correlation coefficient (R) of 0.258 and weighted average of 5.1%. Similarly, the statistical analysis conducted on geographies consisting of 429,302,225 people shows a poor positive correlation between the proportion of Immigrants from Africa and unemployment rate among population between the ages 55 and 59 in the United States with a correlation coefficient (R) of 0.186 and weighted average of 4.8%, a difference of 5.9%.
Immigrants from Greece vs Immigrants from Africa Unemployment Among Ages 55 to 59 years

Unemployment Among Ages 55 to 59 years Correlation Summary

MeasurementImmigrants from GreeceImmigrants from Africa
Minimum0.78%1.5%
Maximum16.6%13.1%
Range15.8%11.6%
Mean5.8%5.2%
Median5.0%4.8%
Interquartile 25% (IQ1)4.4%4.2%
Interquartile 75% (IQ3)6.5%5.7%
Interquartile Range (IQR)2.1%1.5%
Standard Deviation (Sample)2.7%1.9%
Standard Deviation (Population)2.7%1.9%

Similar Demographics by Unemployment Among Ages 55 to 59 years

Demographics Similar to Immigrants from Greece by Unemployment Among Ages 55 to 59 years

In terms of unemployment among ages 55 to 59 years, the demographic groups most similar to Immigrants from Greece are Soviet Union (5.1%, a difference of 0.010%), Immigrants from Honduras (5.1%, a difference of 0.010%), Native Hawaiian (5.1%, a difference of 0.18%), Comanche (5.1%, a difference of 0.21%), and Immigrants from Fiji (5.1%, a difference of 0.23%).
DemographicsRating | RankUnemployment Among Ages 55 to 59 years
French American Indians
1.2
/100
|
#239
Tragic
5.0%
Immigrants | Costa Rica
1.1
/100
|
#240
Tragic
5.0%
Brazilians
1.0
/100
|
#241
Tragic
5.0%
Liberians
0.9
/100
|
#242
Tragic
5.1%
Hondurans
0.7
/100
|
#243
Tragic
5.1%
Immigrants | Fiji
0.7
/100
|
#244
Tragic
5.1%
Soviet Union
0.6
/100
|
#245
Tragic
5.1%
Immigrants | Greece
0.6
/100
|
#246
Tragic
5.1%
Immigrants | Honduras
0.5
/100
|
#247
Tragic
5.1%
Native Hawaiians
0.5
/100
|
#248
Tragic
5.1%
Comanche
0.4
/100
|
#249
Tragic
5.1%
Cheyenne
0.4
/100
|
#250
Tragic
5.1%
Portuguese
0.3
/100
|
#251
Tragic
5.1%
U.S. Virgin Islanders
0.3
/100
|
#252
Tragic
5.1%
Paraguayans
0.3
/100
|
#253
Tragic
5.1%

Demographics Similar to Immigrants from Africa by Unemployment Among Ages 55 to 59 years

In terms of unemployment among ages 55 to 59 years, the demographic groups most similar to Immigrants from Africa are Korean (4.8%, a difference of 0.020%), Immigrants from Lebanon (4.8%, a difference of 0.020%), Immigrants from Nicaragua (4.8%, a difference of 0.040%), Chickasaw (4.8%, a difference of 0.040%), and American (4.8%, a difference of 0.040%).
DemographicsRating | RankUnemployment Among Ages 55 to 59 years
Immigrants | North Macedonia
66.3
/100
|
#155
Good
4.8%
Italians
66.2
/100
|
#156
Good
4.8%
Carpatho Rusyns
66.0
/100
|
#157
Good
4.8%
Slovaks
65.3
/100
|
#158
Good
4.8%
Immigrants | Nicaragua
65.2
/100
|
#159
Good
4.8%
Chickasaw
65.1
/100
|
#160
Good
4.8%
Koreans
64.6
/100
|
#161
Good
4.8%
Immigrants | Africa
64.2
/100
|
#162
Good
4.8%
Immigrants | Lebanon
63.8
/100
|
#163
Good
4.8%
Americans
63.3
/100
|
#164
Good
4.8%
Immigrants | France
62.0
/100
|
#165
Good
4.8%
Potawatomi
62.0
/100
|
#166
Good
4.8%
Immigrants | Western Europe
60.4
/100
|
#167
Good
4.8%
Immigrants | Cambodia
59.3
/100
|
#168
Average
4.8%
Immigrants | Sudan
58.4
/100
|
#169
Average
4.8%