Immigrants from Greece vs Immigrants from Africa In Labor Force | Age 20-24

COMPARE

Immigrants from Greece
Race
Ancestry
AfghanAfricanAlaska NativeAlaskan AthabascanAlbanianAleutAlsatianAmericanApacheArabArapahoArgentineanArmenianAssyrian/Chaldean/SyriacAustralianAustrianBahamianBangladeshiBarbadianBasqueBelgianBelizeanBermudanBhutaneseBlackfeetBolivianBrazilianBritishBritish West IndianBulgarianBurmeseCajunCambodianCanadianCape VerdeanCarpatho RusynCelticCentral AmericanCentral American IndianCherokeeCheyenneChickasawChileanChineseChippewaChoctawColombianColvilleComancheCosta RicanCreeCreekCroatianCrowCubanCypriotCzechCzechoslovakianDanishDelawareDominicanDutchDutch West IndianEastern EuropeanEcuadorianEgyptianEnglishEstonianEthiopianEuropeanFijianFilipinoFinnishFrenchFrench American IndianFrench CanadianGermanGerman RussianGhanaianGreekGuamanian/ChamorroGuatemalanGuyaneseHaitianHmongHonduranHopiHoumaHungarianIcelanderIndian (Asian)IndonesianInupiatIranianIraqiIrishIroquoisIsraeliItalianJamaicanJapaneseJordanianKenyanKiowaKoreanLaotianLatvianLebaneseLiberianLithuanianLumbeeLuxembourgerMacedonianMalaysianMalteseMarshalleseMenomineeMexicanMexican American IndianMongolianMoroccanNative HawaiianNavajoNepaleseNew ZealanderNicaraguanNigerianNorthern EuropeanNorwegianOkinawanOsageOttawaPaiutePakistaniPalestinianPanamanianParaguayanPennsylvania GermanPeruvianPimaPolishPortuguesePotawatomiPuebloPuerto RicanPuget Sound SalishRomanianRussianSalvadoranSamoanScandinavianScotch-IrishScottishSeminoleSenegaleseSerbianShoshoneSierra LeoneanSiouxSlavicSlovakSloveneSomaliSouth AfricanSouth AmericanSouth American IndianSoviet UnionSpaniardSpanishSpanish AmericanSpanish American IndianSri LankanSubsaharan AfricanSudaneseSwedishSwissSyrianTaiwaneseThaiTlingit-HaidaTohono O'OdhamTonganTrinidadian and TobagonianTsimshianTurkishU.S. Virgin IslanderUgandanUkrainianUruguayanUteVenezuelanVietnameseWelshWest IndianYakamaYaquiYugoslavianYumanYup'ikZimbabwean
Immigration
NonimmigrantsImmigrantsAfghanistanAlbaniaArgentinaArmeniaAsiaAustraliaAustriaBahamasBangladeshBarbadosBelarusBelgiumBelizeBoliviaBosnia and HerzegovinaBrazilBulgariaBurma/MyanmarCabo VerdeCambodiaCameroonCanadaCaribbeanCentral AmericaChileChinaColombiaCongoCosta RicaCroatiaCubaCzechoslovakiaDenmarkDominicaDominican RepublicEastern AfricaEastern AsiaEastern EuropeEcuadorEgyptEl SalvadorEnglandEritreaEthiopiaEuropeFijiFranceGermanyGhanaGreeceGrenadaGuatemalaGuyanaHaitiHondurasHong KongHungaryIndiaIndonesiaIranIraqIrelandIsraelItalyJamaicaJapanJordanKazakhstanKenyaKoreaKuwaitLaosLatin AmericaLatviaLebanonLiberiaLithuaniaMalaysiaMexicoMicronesiaMiddle AfricaMoldovaMoroccoNepalNetherlandsNicaraguaNigeriaNorth AmericaNorth MacedoniaNorthern AfricaNorthern EuropeNorwayOceaniaPakistanPanamaPeruPhilippinesPolandPortugalRomaniaRussiaSaudi ArabiaScotlandSenegalSerbiaSierra LeoneSingaporeSomaliaSouth AfricaSouth AmericaSouth Central AsiaSouth Eastern AsiaSouthern EuropeSpainSri LankaSt. Vincent and the GrenadinesSudanSwedenSwitzerlandSyriaTaiwanThailandTrinidad and TobagoTurkeyUgandaUkraineUruguayUzbekistanVenezuelaVietnamWest IndiesWestern AfricaWestern AsiaWestern EuropeYemenZaireZimbabweAzores
Immigrants from Africa
Race
Ancestry
AfghanAfricanAlaska NativeAlaskan AthabascanAlbanianAleutAlsatianAmericanApacheArabArapahoArgentineanArmenianAssyrian/Chaldean/SyriacAustralianAustrianBahamianBangladeshiBarbadianBasqueBelgianBelizeanBermudanBhutaneseBlackfeetBolivianBrazilianBritishBritish West IndianBulgarianBurmeseCajunCambodianCanadianCape VerdeanCarpatho RusynCelticCentral AmericanCentral American IndianCherokeeCheyenneChickasawChileanChineseChippewaChoctawColombianColvilleComancheCosta RicanCreeCreekCroatianCrowCubanCypriotCzechCzechoslovakianDanishDelawareDominicanDutchDutch West IndianEastern EuropeanEcuadorianEgyptianEnglishEstonianEthiopianEuropeanFijianFilipinoFinnishFrenchFrench American IndianFrench CanadianGermanGerman RussianGhanaianGreekGuamanian/ChamorroGuatemalanGuyaneseHaitianHmongHonduranHopiHoumaHungarianIcelanderIndian (Asian)IndonesianInupiatIranianIraqiIrishIroquoisIsraeliItalianJamaicanJapaneseJordanianKenyanKiowaKoreanLaotianLatvianLebaneseLiberianLithuanianLumbeeLuxembourgerMacedonianMalaysianMalteseMarshalleseMenomineeMexicanMexican American IndianMongolianMoroccanNative HawaiianNavajoNepaleseNew ZealanderNicaraguanNigerianNorthern EuropeanNorwegianOkinawanOsageOttawaPaiutePakistaniPalestinianPanamanianParaguayanPennsylvania GermanPeruvianPimaPolishPortuguesePotawatomiPuebloPuerto RicanPuget Sound SalishRomanianRussianSalvadoranSamoanScandinavianScotch-IrishScottishSeminoleSenegaleseSerbianShoshoneSierra LeoneanSiouxSlavicSlovakSloveneSomaliSouth AfricanSouth AmericanSouth American IndianSoviet UnionSpaniardSpanishSpanish AmericanSpanish American IndianSri LankanSubsaharan AfricanSudaneseSwedishSwissSyrianTaiwaneseThaiTlingit-HaidaTohono O'OdhamTonganTrinidadian and TobagonianTsimshianTurkishU.S. Virgin IslanderUgandanUkrainianUruguayanUteVenezuelanVietnameseWelshWest IndianYakamaYaquiYugoslavianYumanYup'ikZimbabwean
Immigration
NonimmigrantsImmigrantsAfghanistanAfricaAlbaniaArgentinaArmeniaAsiaAustraliaAustriaBahamasBangladeshBarbadosBelarusBelgiumBelizeBoliviaBosnia and HerzegovinaBrazilBulgariaBurma/MyanmarCabo VerdeCambodiaCameroonCanadaCaribbeanCentral AmericaChileChinaColombiaCongoCosta RicaCroatiaCubaCzechoslovakiaDenmarkDominicaDominican RepublicEastern AfricaEastern AsiaEastern EuropeEcuadorEgyptEl SalvadorEnglandEritreaEthiopiaEuropeFijiFranceGermanyGhanaGrenadaGuatemalaGuyanaHaitiHondurasHong KongHungaryIndiaIndonesiaIranIraqIrelandIsraelItalyJamaicaJapanJordanKazakhstanKenyaKoreaKuwaitLaosLatin AmericaLatviaLebanonLiberiaLithuaniaMalaysiaMexicoMicronesiaMiddle AfricaMoldovaMoroccoNepalNetherlandsNicaraguaNigeriaNorth AmericaNorth MacedoniaNorthern AfricaNorthern EuropeNorwayOceaniaPakistanPanamaPeruPhilippinesPolandPortugalRomaniaRussiaSaudi ArabiaScotlandSenegalSerbiaSierra LeoneSingaporeSomaliaSouth AfricaSouth AmericaSouth Central AsiaSouth Eastern AsiaSouthern EuropeSpainSri LankaSt. Vincent and the GrenadinesSudanSwedenSwitzerlandSyriaTaiwanThailandTrinidad and TobagoTurkeyUgandaUkraineUruguayUzbekistanVenezuelaVietnamWest IndiesWestern AfricaWestern AsiaWestern EuropeYemenZaireZimbabweAzores
In Labor Force | Age 20-24
Income
Poverty
Unemployment
Labor Participation
Family Structure
Vehicle Availability
Education Level
Disability

In Labor Force | Age 20-24 Comparison

Immigrants from Greece

Immigrants from Africa

Tragic
Exceptional
74.2%
IN LABOR FORCE | AGE 20-24
4.1/ 100
METRIC RATING
231st/ 347
METRIC RANK
75.8%
IN LABOR FORCE | AGE 20-24
94.6/ 100
METRIC RATING
120th/ 347
METRIC RANK

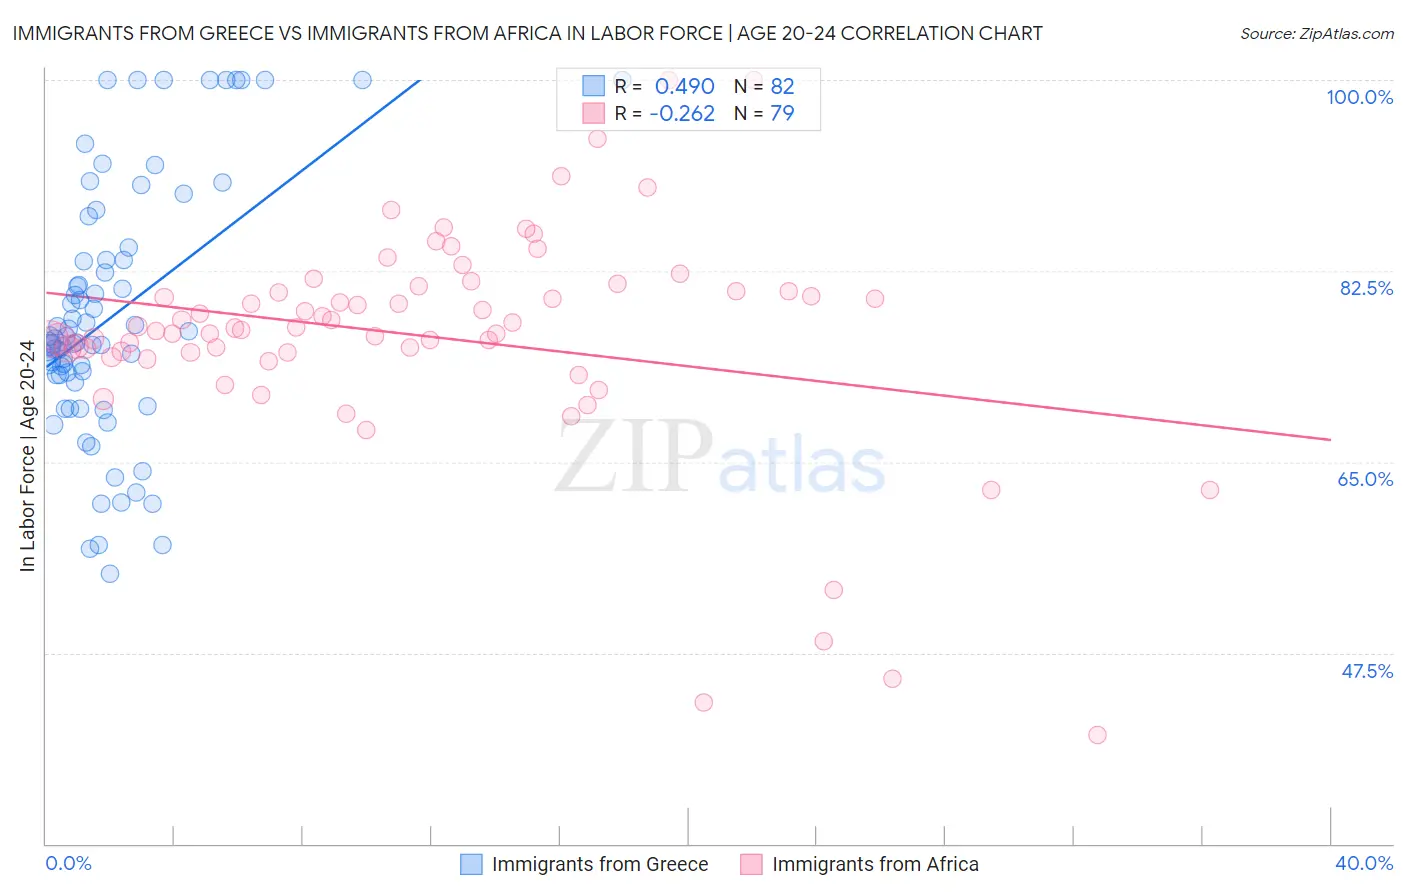
Immigrants from Greece vs Immigrants from Africa In Labor Force | Age 20-24 Correlation Chart

The statistical analysis conducted on geographies consisting of 216,782,866 people shows a moderate positive correlation between the proportion of Immigrants from Greece and labor force participation rate among population between the ages 20 and 24 in the United States with a correlation coefficient (R) of 0.490 and weighted average of 74.2%. Similarly, the statistical analysis conducted on geographies consisting of 469,218,612 people shows a weak negative correlation between the proportion of Immigrants from Africa and labor force participation rate among population between the ages 20 and 24 in the United States with a correlation coefficient (R) of -0.262 and weighted average of 75.8%, a difference of 2.2%.
Immigrants from Greece vs Immigrants from Africa In Labor Force | Age 20-24

In Labor Force | Age 20-24 Correlation Summary

MeasurementImmigrants from GreeceImmigrants from Africa
Minimum54.8%40.0%
Maximum100.0%100.0%
Range45.2%60.0%
Mean78.4%76.5%
Median76.1%77.3%
Interquartile 25% (IQ1)72.9%75.0%
Interquartile 75% (IQ3)83.5%80.6%
Interquartile Range (IQR)10.6%5.6%
Standard Deviation (Sample)11.6%10.4%
Standard Deviation (Population)11.5%10.3%

Similar Demographics by In Labor Force | Age 20-24

Demographics Similar to Immigrants from Greece by In Labor Force | Age 20-24

In terms of in labor force | age 20-24, the demographic groups most similar to Immigrants from Greece are Immigrants from Switzerland (74.2%, a difference of 0.010%), Immigrants from Albania (74.2%, a difference of 0.020%), Immigrants from Sweden (74.2%, a difference of 0.040%), Immigrants from Chile (74.1%, a difference of 0.050%), and Immigrants (74.1%, a difference of 0.060%).
DemographicsRating | RankIn Labor Force | Age 20-24
Seminole
6.9
/100
|
#224
Tragic
74.3%
Ghanaians
6.2
/100
|
#225
Tragic
74.3%
Immigrants | Fiji
5.9
/100
|
#226
Tragic
74.3%
Immigrants | Ireland
5.8
/100
|
#227
Tragic
74.3%
Immigrants | Ukraine
5.1
/100
|
#228
Tragic
74.2%
Immigrants | Sweden
4.6
/100
|
#229
Tragic
74.2%
Immigrants | Albania
4.3
/100
|
#230
Tragic
74.2%
Immigrants | Greece
4.1
/100
|
#231
Tragic
74.2%
Immigrants | Switzerland
4.1
/100
|
#232
Tragic
74.2%
Immigrants | Chile
3.7
/100
|
#233
Tragic
74.1%
Immigrants | Immigrants
3.6
/100
|
#234
Tragic
74.1%
Laotians
3.5
/100
|
#235
Tragic
74.1%
Immigrants | France
3.3
/100
|
#236
Tragic
74.1%
Bermudans
3.2
/100
|
#237
Tragic
74.1%
Immigrants | Japan
3.0
/100
|
#238
Tragic
74.1%

Demographics Similar to Immigrants from Africa by In Labor Force | Age 20-24

In terms of in labor force | age 20-24, the demographic groups most similar to Immigrants from Africa are Spanish American (75.8%, a difference of 0.010%), Immigrants from Portugal (75.8%, a difference of 0.010%), Assyrian/Chaldean/Syriac (75.9%, a difference of 0.020%), Alaska Native (75.9%, a difference of 0.030%), and Immigrants from North America (75.9%, a difference of 0.030%).
DemographicsRating | RankIn Labor Force | Age 20-24
Immigrants | Netherlands
95.3
/100
|
#113
Exceptional
75.9%
Immigrants | Zimbabwe
95.1
/100
|
#114
Exceptional
75.9%
Alaska Natives
95.1
/100
|
#115
Exceptional
75.9%
Immigrants | North America
95.0
/100
|
#116
Exceptional
75.9%
Assyrians/Chaldeans/Syriacs
94.9
/100
|
#117
Exceptional
75.9%
Spanish Americans
94.8
/100
|
#118
Exceptional
75.8%
Immigrants | Portugal
94.8
/100
|
#119
Exceptional
75.8%
Immigrants | Africa
94.6
/100
|
#120
Exceptional
75.8%
Immigrants | Serbia
94.3
/100
|
#121
Exceptional
75.8%
Pakistanis
94.1
/100
|
#122
Exceptional
75.8%
Immigrants | Bulgaria
94.1
/100
|
#123
Exceptional
75.8%
Immigrants | Sierra Leone
93.8
/100
|
#124
Exceptional
75.8%
Immigrants | Scotland
93.7
/100
|
#125
Exceptional
75.8%
Brazilians
93.0
/100
|
#126
Exceptional
75.8%
Sub-Saharan Africans
90.9
/100
|
#127
Exceptional
75.7%