Immigrants from Eastern Africa vs Immigrants from India Unemployment
COMPARE
Immigrants from Eastern Africa
Immigrants from India
Unemployment
Unemployment Comparison
Immigrants from Eastern Africa
Immigrants from India
5.1%
UNEMPLOYMENT
88.1/ 100
METRIC RATING
128th/ 347
METRIC RANK
4.5%
UNEMPLOYMENT
100.0/ 100
METRIC RATING
7th/ 347
METRIC RANK
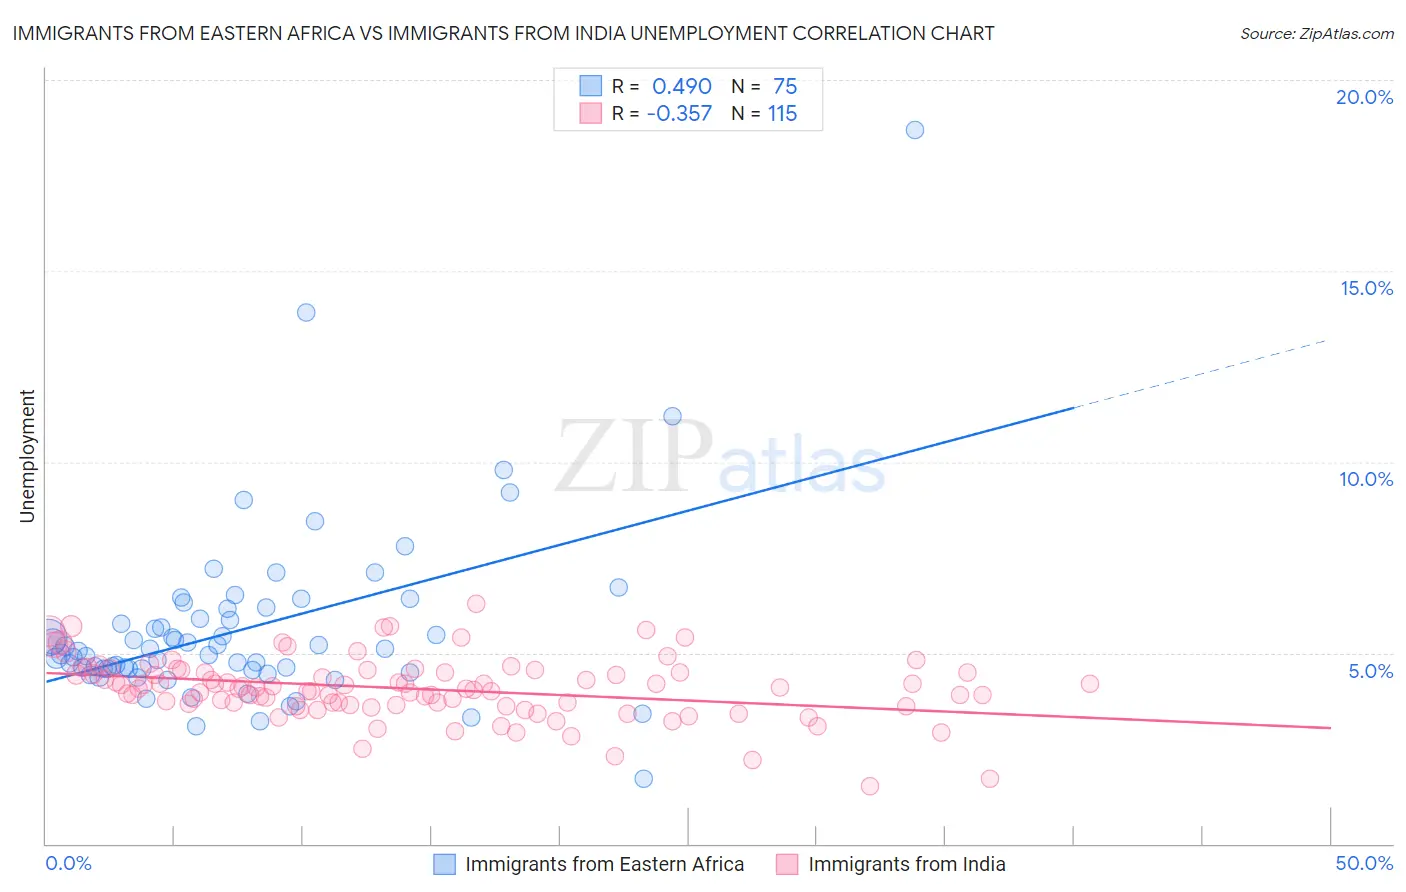
Immigrants from Eastern Africa vs Immigrants from India Unemployment Correlation Chart
The statistical analysis conducted on geographies consisting of 354,902,578 people shows a moderate positive correlation between the proportion of Immigrants from Eastern Africa and unemployment in the United States with a correlation coefficient (R) of 0.490 and weighted average of 5.1%. Similarly, the statistical analysis conducted on geographies consisting of 433,651,365 people shows a mild negative correlation between the proportion of Immigrants from India and unemployment in the United States with a correlation coefficient (R) of -0.357 and weighted average of 4.5%, a difference of 13.0%.
Unemployment Correlation Summary
| Measurement | Immigrants from Eastern Africa | Immigrants from India |
| Minimum | 1.7% | 1.5% |
| Maximum | 18.7% | 6.3% |
| Range | 17.0% | 4.8% |
| Mean | 5.6% | 4.1% |
| Median | 5.0% | 4.1% |
| Interquartile 25% (IQ1) | 4.6% | 3.6% |
| Interquartile 75% (IQ3) | 6.1% | 4.5% |
| Interquartile Range (IQR) | 1.6% | 0.85% |
| Standard Deviation (Sample) | 2.4% | 0.80% |
| Standard Deviation (Population) | 2.4% | 0.80% |
Similar Demographics by Unemployment
Demographics Similar to Immigrants from Eastern Africa by Unemployment
In terms of unemployment, the demographic groups most similar to Immigrants from Eastern Africa are Immigrants from Latvia (5.1%, a difference of 0.0%), Kenyan (5.1%, a difference of 0.020%), Immigrants from Kenya (5.1%, a difference of 0.020%), Immigrants from Eastern Asia (5.1%, a difference of 0.040%), and Ethiopian (5.1%, a difference of 0.090%).
| Demographics | Rating | Rank | Unemployment |
| Lebanese | 89.2 /100 | #121 | Excellent 5.1% |
| Immigrants | Switzerland | 89.1 /100 | #122 | Excellent 5.1% |
| Asians | 89.0 /100 | #123 | Excellent 5.1% |
| Ethiopians | 88.6 /100 | #124 | Excellent 5.1% |
| Immigrants | Eastern Asia | 88.3 /100 | #125 | Excellent 5.1% |
| Kenyans | 88.2 /100 | #126 | Excellent 5.1% |
| Immigrants | Kenya | 88.2 /100 | #127 | Excellent 5.1% |
| Immigrants | Eastern Africa | 88.1 /100 | #128 | Excellent 5.1% |
| Immigrants | Latvia | 88.0 /100 | #129 | Excellent 5.1% |
| Iranians | 86.9 /100 | #130 | Excellent 5.1% |
| Immigrants | Croatia | 86.8 /100 | #131 | Excellent 5.1% |
| Immigrants | Ethiopia | 86.7 /100 | #132 | Excellent 5.1% |
| Immigrants | Jordan | 86.6 /100 | #133 | Excellent 5.1% |
| Immigrants | Europe | 86.3 /100 | #134 | Excellent 5.1% |
| Immigrants | Burma/Myanmar | 86.2 /100 | #135 | Excellent 5.1% |
Demographics Similar to Immigrants from India by Unemployment
In terms of unemployment, the demographic groups most similar to Immigrants from India are Swiss (4.5%, a difference of 0.46%), German (4.5%, a difference of 0.55%), Scandinavian (4.5%, a difference of 0.86%), Swedish (4.4%, a difference of 1.3%), and Dutch (4.6%, a difference of 1.4%).
| Demographics | Rating | Rank | Unemployment |
| Norwegians | 100.0 /100 | #1 | Exceptional 4.2% |
| Luxembourgers | 100.0 /100 | #2 | Exceptional 4.3% |
| Czechs | 100.0 /100 | #3 | Exceptional 4.3% |
| Danes | 100.0 /100 | #4 | Exceptional 4.3% |
| Swedes | 100.0 /100 | #5 | Exceptional 4.4% |
| Germans | 100.0 /100 | #6 | Exceptional 4.5% |
| Immigrants | India | 100.0 /100 | #7 | Exceptional 4.5% |
| Swiss | 100.0 /100 | #8 | Exceptional 4.5% |
| Scandinavians | 100.0 /100 | #9 | Exceptional 4.5% |
| Dutch | 100.0 /100 | #10 | Exceptional 4.6% |
| English | 100.0 /100 | #11 | Exceptional 4.6% |
| Pennsylvania Germans | 100.0 /100 | #12 | Exceptional 4.6% |
| Belgians | 100.0 /100 | #13 | Exceptional 4.6% |
| Immigrants | Cuba | 100.0 /100 | #14 | Exceptional 4.6% |
| Europeans | 99.9 /100 | #15 | Exceptional 4.6% |