Immigrants from Dominica vs Filipino Unemployment
COMPARE
Immigrants from Dominica
Filipino
Unemployment
Unemployment Comparison
Immigrants from Dominica
Filipinos
6.7%
UNEMPLOYMENT
0.0/ 100
METRIC RATING
316th/ 347
METRIC RANK
4.8%
UNEMPLOYMENT
99.5/ 100
METRIC RATING
42nd/ 347
METRIC RANK
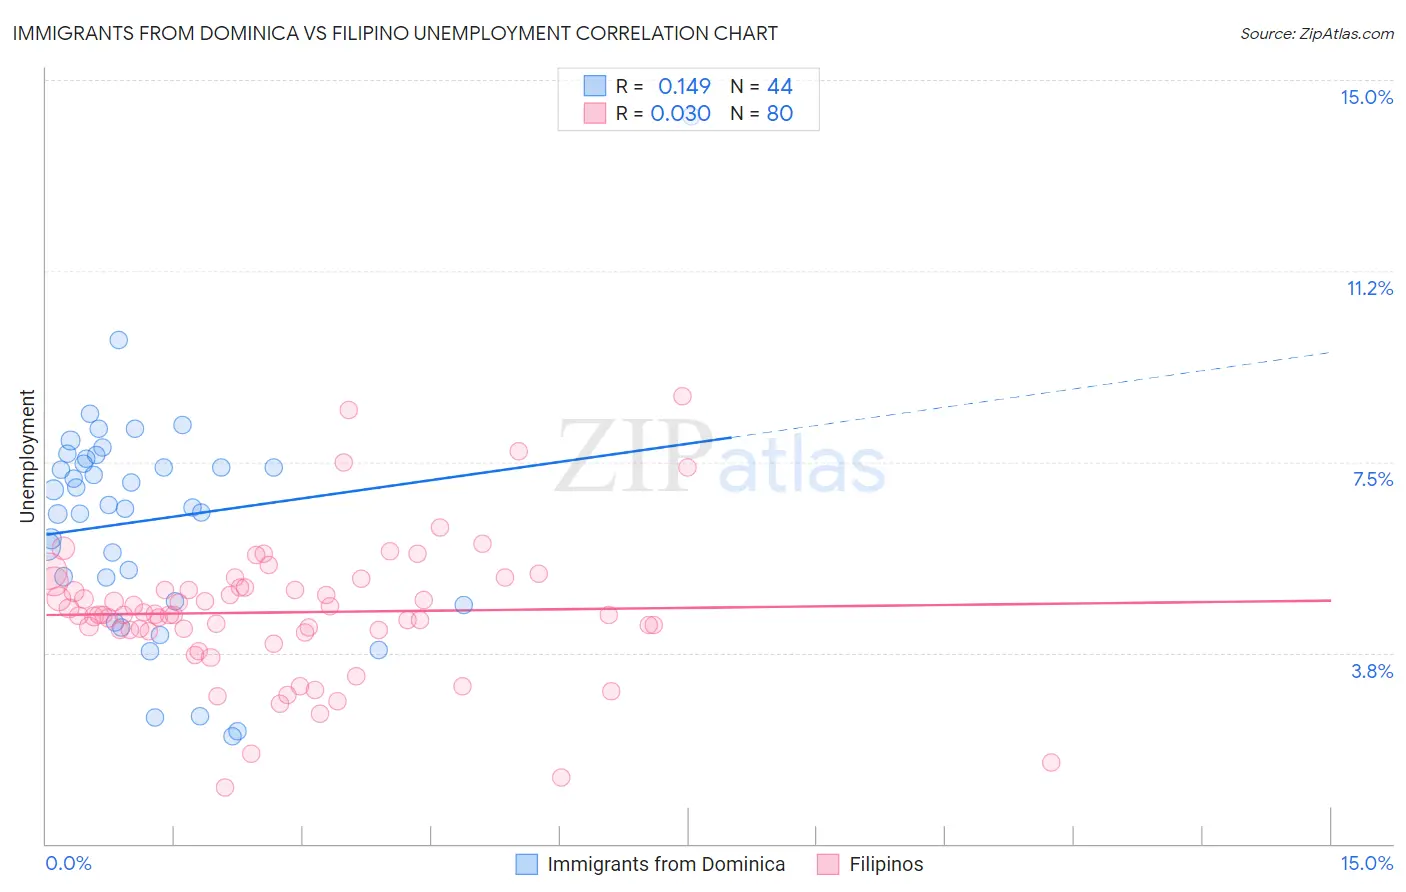
Immigrants from Dominica vs Filipino Unemployment Correlation Chart
The statistical analysis conducted on geographies consisting of 83,789,741 people shows a poor positive correlation between the proportion of Immigrants from Dominica and unemployment in the United States with a correlation coefficient (R) of 0.149 and weighted average of 6.7%. Similarly, the statistical analysis conducted on geographies consisting of 254,275,542 people shows no correlation between the proportion of Filipinos and unemployment in the United States with a correlation coefficient (R) of 0.030 and weighted average of 4.8%, a difference of 39.8%.
Unemployment Correlation Summary
| Measurement | Immigrants from Dominica | Filipino |
| Minimum | 2.1% | 1.1% |
| Maximum | 14.3% | 8.8% |
| Range | 12.2% | 7.7% |
| Mean | 6.4% | 4.5% |
| Median | 6.6% | 4.5% |
| Interquartile 25% (IQ1) | 5.0% | 4.2% |
| Interquartile 75% (IQ3) | 7.5% | 5.0% |
| Interquartile Range (IQR) | 2.5% | 0.84% |
| Standard Deviation (Sample) | 2.2% | 1.4% |
| Standard Deviation (Population) | 2.2% | 1.4% |
Similar Demographics by Unemployment
Demographics Similar to Immigrants from Dominica by Unemployment
In terms of unemployment, the demographic groups most similar to Immigrants from Dominica are Shoshone (6.8%, a difference of 0.58%), Houma (6.7%, a difference of 0.83%), Immigrants from Cabo Verde (6.8%, a difference of 1.2%), British West Indian (6.8%, a difference of 1.4%), and Black/African American (6.6%, a difference of 1.6%).
| Demographics | Rating | Rank | Unemployment |
| Vietnamese | 0.0 /100 | #309 | Tragic 6.5% |
| Immigrants | Belize | 0.0 /100 | #310 | Tragic 6.5% |
| Cape Verdeans | 0.0 /100 | #311 | Tragic 6.5% |
| Colville | 0.0 /100 | #312 | Tragic 6.6% |
| Immigrants | Barbados | 0.0 /100 | #313 | Tragic 6.6% |
| Blacks/African Americans | 0.0 /100 | #314 | Tragic 6.6% |
| Houma | 0.0 /100 | #315 | Tragic 6.7% |
| Immigrants | Dominica | 0.0 /100 | #316 | Tragic 6.7% |
| Shoshone | 0.0 /100 | #317 | Tragic 6.8% |
| Immigrants | Cabo Verde | 0.0 /100 | #318 | Tragic 6.8% |
| British West Indians | 0.0 /100 | #319 | Tragic 6.8% |
| Immigrants | St. Vincent and the Grenadines | 0.0 /100 | #320 | Tragic 6.9% |
| Immigrants | Guyana | 0.0 /100 | #321 | Tragic 6.9% |
| Guyanese | 0.0 /100 | #322 | Tragic 6.9% |
| Immigrants | Grenada | 0.0 /100 | #323 | Tragic 6.9% |
Demographics Similar to Filipinos by Unemployment
In terms of unemployment, the demographic groups most similar to Filipinos are Yugoslavian (4.8%, a difference of 0.20%), Austrian (4.8%, a difference of 0.26%), French (4.8%, a difference of 0.31%), Immigrants from Bosnia and Herzegovina (4.8%, a difference of 0.48%), and Immigrants from Nepal (4.8%, a difference of 0.48%).
| Demographics | Rating | Rank | Unemployment |
| Scotch-Irish | 99.8 /100 | #35 | Exceptional 4.8% |
| Tongans | 99.7 /100 | #36 | Exceptional 4.8% |
| Czechoslovakians | 99.7 /100 | #37 | Exceptional 4.8% |
| Bolivians | 99.7 /100 | #38 | Exceptional 4.8% |
| Lithuanians | 99.7 /100 | #39 | Exceptional 4.8% |
| Northern Europeans | 99.7 /100 | #40 | Exceptional 4.8% |
| Immigrants | Bosnia and Herzegovina | 99.7 /100 | #41 | Exceptional 4.8% |
| Filipinos | 99.5 /100 | #42 | Exceptional 4.8% |
| Yugoslavians | 99.5 /100 | #43 | Exceptional 4.8% |
| Austrians | 99.5 /100 | #44 | Exceptional 4.8% |
| French | 99.5 /100 | #45 | Exceptional 4.8% |
| Immigrants | Nepal | 99.4 /100 | #46 | Exceptional 4.8% |
| Immigrants | Taiwan | 99.4 /100 | #47 | Exceptional 4.8% |
| Immigrants | Scotland | 99.3 /100 | #48 | Exceptional 4.9% |
| Immigrants | South Central Asia | 99.3 /100 | #49 | Exceptional 4.9% |