Immigrants from Cuba vs Eastern European Unemployment Among Ages 65 to 74 years

COMPARE

Immigrants from Cuba
Race
Ancestry
AfghanAfricanAlaska NativeAlaskan AthabascanAlbanianAleutAlsatianAmericanApacheArabArapahoArgentineanArmenianAssyrian/Chaldean/SyriacAustralianAustrianBahamianBangladeshiBarbadianBasqueBelgianBelizeanBermudanBhutaneseBlackfeetBolivianBrazilianBritishBritish West IndianBulgarianBurmeseCajunCambodianCanadianCape VerdeanCarpatho RusynCelticCentral AmericanCentral American IndianCherokeeCheyenneChickasawChileanChineseChippewaChoctawColombianColvilleComancheCosta RicanCreeCreekCroatianCrowCubanCypriotCzechCzechoslovakianDanishDelawareDominicanDutchDutch West IndianEcuadorianEgyptianEnglishEstonianEthiopianEuropeanFijianFilipinoFinnishFrenchFrench American IndianFrench CanadianGermanGerman RussianGhanaianGreekGuamanian/ChamorroGuatemalanGuyaneseHaitianHmongHonduranHopiHoumaHungarianIcelanderIndian (Asian)IndonesianInupiatIranianIraqiIrishIroquoisIsraeliItalianJamaicanJapaneseJordanianKenyanKiowaKoreanLaotianLatvianLebaneseLiberianLithuanianLumbeeLuxembourgerMacedonianMalaysianMalteseMarshalleseMenomineeMexicanMexican American IndianMongolianMoroccanNative HawaiianNavajoNepaleseNew ZealanderNicaraguanNigerianNorthern EuropeanNorwegianOkinawanOsageOttawaPaiutePakistaniPalestinianPanamanianParaguayanPennsylvania GermanPeruvianPimaPolishPortuguesePotawatomiPuebloPuerto RicanPuget Sound SalishRomanianRussianSalvadoranSamoanScandinavianScotch-IrishScottishSeminoleSenegaleseSerbianShoshoneSierra LeoneanSiouxSlavicSlovakSloveneSomaliSouth AfricanSouth AmericanSouth American IndianSoviet UnionSpaniardSpanishSpanish AmericanSpanish American IndianSri LankanSubsaharan AfricanSudaneseSwedishSwissSyrianTaiwaneseThaiTlingit-HaidaTohono O'OdhamTonganTrinidadian and TobagonianTsimshianTurkishU.S. Virgin IslanderUgandanUkrainianUruguayanUteVenezuelanVietnameseWelshWest IndianYakamaYaquiYugoslavianYumanYup'ikZimbabwean
Immigration
NonimmigrantsImmigrantsAfghanistanAfricaAlbaniaArgentinaArmeniaAsiaAustraliaAustriaBahamasBangladeshBarbadosBelarusBelgiumBelizeBoliviaBosnia and HerzegovinaBrazilBulgariaBurma/MyanmarCabo VerdeCambodiaCameroonCanadaCaribbeanCentral AmericaChileChinaColombiaCongoCosta RicaCroatiaCubaCzechoslovakiaDenmarkDominicaDominican RepublicEastern AfricaEastern AsiaEastern EuropeEcuadorEgyptEl SalvadorEnglandEritreaEthiopiaEuropeFijiFranceGermanyGhanaGreeceGrenadaGuatemalaGuyanaHaitiHondurasHong KongHungaryIndiaIndonesiaIranIraqIrelandIsraelItalyJamaicaJapanJordanKazakhstanKenyaKoreaKuwaitLaosLatin AmericaLatviaLebanonLiberiaLithuaniaMalaysiaMexicoMicronesiaMiddle AfricaMoldovaMoroccoNepalNetherlandsNicaraguaNigeriaNorth AmericaNorth MacedoniaNorthern AfricaNorthern EuropeNorwayOceaniaPakistanPanamaPeruPhilippinesPolandPortugalRomaniaRussiaSaudi ArabiaScotlandSenegalSerbiaSierra LeoneSingaporeSomaliaSouth AfricaSouth AmericaSouth Central AsiaSouth Eastern AsiaSouthern EuropeSpainSri LankaSt. Vincent and the GrenadinesSudanSwedenSwitzerlandSyriaTaiwanThailandTrinidad and TobagoTurkeyUgandaUkraineUruguayUzbekistanVenezuelaVietnamWest IndiesWestern AfricaWestern AsiaWestern EuropeYemenZaireZimbabweAzores
Eastern European
Race
Ancestry
AfghanAfricanAlaska NativeAlaskan AthabascanAlbanianAleutAlsatianAmericanApacheArabArapahoArgentineanArmenianAssyrian/Chaldean/SyriacAustralianAustrianBahamianBangladeshiBarbadianBasqueBelgianBelizeanBermudanBhutaneseBlackfeetBolivianBrazilianBritishBritish West IndianBulgarianBurmeseCajunCambodianCanadianCape VerdeanCarpatho RusynCelticCentral AmericanCentral American IndianCherokeeCheyenneChickasawChileanChineseChippewaChoctawColombianColvilleComancheCosta RicanCreeCreekCroatianCrowCubanCypriotCzechCzechoslovakianDanishDelawareDominicanDutchDutch West IndianEastern EuropeanEcuadorianEgyptianEnglishEstonianEthiopianEuropeanFijianFilipinoFinnishFrenchFrench American IndianFrench CanadianGermanGerman RussianGhanaianGreekGuamanian/ChamorroGuatemalanGuyaneseHaitianHmongHonduranHopiHoumaHungarianIcelanderIndian (Asian)IndonesianInupiatIranianIraqiIrishIroquoisIsraeliItalianJamaicanJapaneseJordanianKenyanKiowaKoreanLaotianLatvianLebaneseLiberianLithuanianLumbeeLuxembourgerMacedonianMalaysianMalteseMarshalleseMenomineeMexicanMexican American IndianMongolianMoroccanNative HawaiianNavajoNepaleseNew ZealanderNicaraguanNigerianNorthern EuropeanNorwegianOkinawanOsageOttawaPaiutePakistaniPalestinianPanamanianParaguayanPennsylvania GermanPeruvianPimaPolishPortuguesePotawatomiPuebloPuerto RicanPuget Sound SalishRomanianRussianSalvadoranSamoanScandinavianScotch-IrishScottishSeminoleSenegaleseSerbianShoshoneSierra LeoneanSiouxSlavicSlovakSloveneSomaliSouth AfricanSouth AmericanSouth American IndianSoviet UnionSpaniardSpanishSpanish AmericanSpanish American IndianSri LankanSubsaharan AfricanSudaneseSwedishSwissSyrianTaiwaneseThaiTlingit-HaidaTohono O'OdhamTonganTrinidadian and TobagonianTsimshianTurkishU.S. Virgin IslanderUgandanUkrainianUruguayanUteVenezuelanVietnameseWelshWest IndianYakamaYaquiYugoslavianYumanYup'ikZimbabwean
Immigration
NonimmigrantsImmigrantsAfghanistanAfricaAlbaniaArgentinaArmeniaAsiaAustraliaAustriaBahamasBangladeshBarbadosBelarusBelgiumBelizeBoliviaBosnia and HerzegovinaBrazilBulgariaBurma/MyanmarCabo VerdeCambodiaCameroonCanadaCaribbeanCentral AmericaChileChinaColombiaCongoCosta RicaCroatiaCzechoslovakiaDenmarkDominicaDominican RepublicEastern AfricaEastern AsiaEastern EuropeEcuadorEgyptEl SalvadorEnglandEritreaEthiopiaEuropeFijiFranceGermanyGhanaGreeceGrenadaGuatemalaGuyanaHaitiHondurasHong KongHungaryIndiaIndonesiaIranIraqIrelandIsraelItalyJamaicaJapanJordanKazakhstanKenyaKoreaKuwaitLaosLatin AmericaLatviaLebanonLiberiaLithuaniaMalaysiaMexicoMicronesiaMiddle AfricaMoldovaMoroccoNepalNetherlandsNicaraguaNigeriaNorth AmericaNorth MacedoniaNorthern AfricaNorthern EuropeNorwayOceaniaPakistanPanamaPeruPhilippinesPolandPortugalRomaniaRussiaSaudi ArabiaScotlandSenegalSerbiaSierra LeoneSingaporeSomaliaSouth AfricaSouth AmericaSouth Central AsiaSouth Eastern AsiaSouthern EuropeSpainSri LankaSt. Vincent and the GrenadinesSudanSwedenSwitzerlandSyriaTaiwanThailandTrinidad and TobagoTurkeyUgandaUkraineUruguayUzbekistanVenezuelaVietnamWest IndiesWestern AfricaWestern AsiaWestern EuropeYemenZaireZimbabweAzores
Unemployment Among Ages 65 to 74 years
Income
Poverty
Unemployment
Labor Participation
Family Structure
Vehicle Availability
Education Level
Disability

Unemployment Among Ages 65 to 74 years Comparison

Immigrants from Cuba

Eastern Europeans

Exceptional
Excellent
4.6%
UNEMPLOYMENT AMONG AGES 65 TO 74 YEARS
100.0/ 100
METRIC RATING
6th/ 347
METRIC RANK
5.3%
UNEMPLOYMENT AMONG AGES 65 TO 74 YEARS
85.6/ 100
METRIC RATING
130th/ 347
METRIC RANK

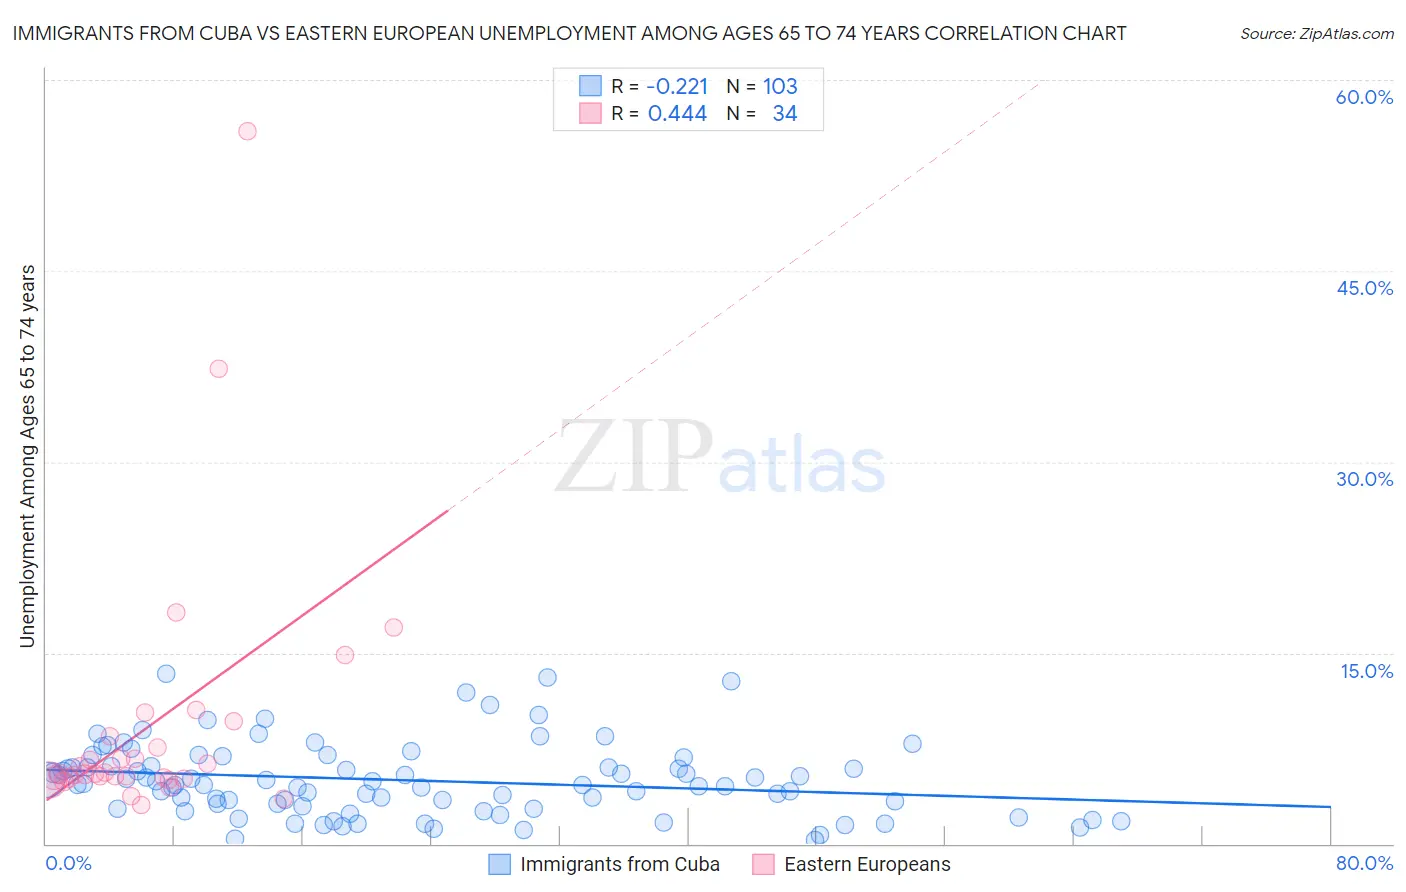
Immigrants from Cuba vs Eastern European Unemployment Among Ages 65 to 74 years Correlation Chart

The statistical analysis conducted on geographies consisting of 295,099,136 people shows a weak negative correlation between the proportion of Immigrants from Cuba and unemployment rate among population between the ages 65 and 74 in the United States with a correlation coefficient (R) of -0.221 and weighted average of 4.6%. Similarly, the statistical analysis conducted on geographies consisting of 390,027,608 people shows a moderate positive correlation between the proportion of Eastern Europeans and unemployment rate among population between the ages 65 and 74 in the United States with a correlation coefficient (R) of 0.444 and weighted average of 5.3%, a difference of 14.3%.
Immigrants from Cuba vs Eastern European Unemployment Among Ages 65 to 74 years

Unemployment Among Ages 65 to 74 years Correlation Summary

MeasurementImmigrants from CubaEastern European
Minimum0.30%3.1%
Maximum13.4%56.0%
Range13.1%52.9%
Mean5.0%9.3%
Median4.7%5.5%
Interquartile 25% (IQ1)2.9%5.2%
Interquartile 75% (IQ3)6.1%8.5%
Interquartile Range (IQR)3.2%3.3%
Standard Deviation (Sample)2.8%10.4%
Standard Deviation (Population)2.8%10.2%

Similar Demographics by Unemployment Among Ages 65 to 74 years

Demographics Similar to Immigrants from Cuba by Unemployment Among Ages 65 to 74 years

In terms of unemployment among ages 65 to 74 years, the demographic groups most similar to Immigrants from Cuba are Sudanese (4.6%, a difference of 0.51%), Tsimshian (4.6%, a difference of 0.88%), Indonesian (4.7%, a difference of 1.4%), Comanche (4.7%, a difference of 1.6%), and Chickasaw (4.7%, a difference of 1.9%).
DemographicsRating | RankUnemployment Among Ages 65 to 74 years
Hmong
100.0
/100
|
#1
Exceptional
4.2%
Chinese
100.0
/100
|
#2
Exceptional
4.4%
Fijians
100.0
/100
|
#3
Exceptional
4.5%
Tsimshian
100.0
/100
|
#4
Exceptional
4.6%
Sudanese
100.0
/100
|
#5
Exceptional
4.6%
Immigrants | Cuba
100.0
/100
|
#6
Exceptional
4.6%
Indonesians
100.0
/100
|
#7
Exceptional
4.7%
Comanche
100.0
/100
|
#8
Exceptional
4.7%
Chickasaw
100.0
/100
|
#9
Exceptional
4.7%
Osage
100.0
/100
|
#10
Exceptional
4.7%
Immigrants | Congo
100.0
/100
|
#11
Exceptional
4.7%
Tongans
100.0
/100
|
#12
Exceptional
4.7%
Lumbee
100.0
/100
|
#13
Exceptional
4.8%
Cubans
100.0
/100
|
#14
Exceptional
4.8%
Immigrants | North Macedonia
100.0
/100
|
#15
Exceptional
4.8%

Demographics Similar to Eastern Europeans by Unemployment Among Ages 65 to 74 years

In terms of unemployment among ages 65 to 74 years, the demographic groups most similar to Eastern Europeans are Immigrants from England (5.3%, a difference of 0.040%), Immigrants from Hong Kong (5.3%, a difference of 0.070%), Immigrants from North America (5.3%, a difference of 0.080%), Immigrants from South Eastern Asia (5.3%, a difference of 0.11%), and Pakistani (5.3%, a difference of 0.13%).
DemographicsRating | RankUnemployment Among Ages 65 to 74 years
Czechoslovakians
88.6
/100
|
#123
Excellent
5.3%
Immigrants | Ukraine
87.5
/100
|
#124
Excellent
5.3%
Pakistanis
87.5
/100
|
#125
Excellent
5.3%
Immigrants | South Eastern Asia
87.2
/100
|
#126
Excellent
5.3%
Immigrants | North America
86.7
/100
|
#127
Excellent
5.3%
Immigrants | Hong Kong
86.5
/100
|
#128
Excellent
5.3%
Immigrants | England
86.2
/100
|
#129
Excellent
5.3%
Eastern Europeans
85.6
/100
|
#130
Excellent
5.3%
Immigrants | Russia
83.0
/100
|
#131
Excellent
5.3%
Koreans
82.6
/100
|
#132
Excellent
5.3%
Ukrainians
82.0
/100
|
#133
Excellent
5.3%
Immigrants | Panama
81.8
/100
|
#134
Excellent
5.3%
Immigrants | Serbia
81.8
/100
|
#135
Excellent
5.3%
Celtics
80.8
/100
|
#136
Excellent
5.3%
Immigrants | Afghanistan
80.8
/100
|
#137
Excellent
5.3%